
Figure 3.
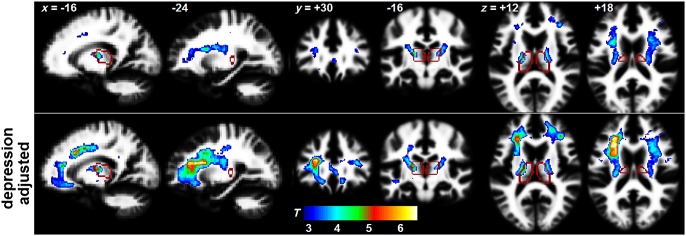
Clusters before (top row) and after (bottom row) adjustment for depression for the T1-weighted spin-echo (T1w) versus chronic fatigue syndrome (CFS) disability regression. The voxel threshold for cluster formation was P = 0.005 (T = 2.8). The edges of the thalamus are shown in red. The peak voxel shifted from the left ventrolateral thalamus–internal capsule junction near x = –16, y = –16, z = +12 in the top row to the left prefrontal white matter (WM) near x = –24, y = +30, z = +18 in the bottom row, indicating that depression effects were stronger more rostrally.