
Figure 2.
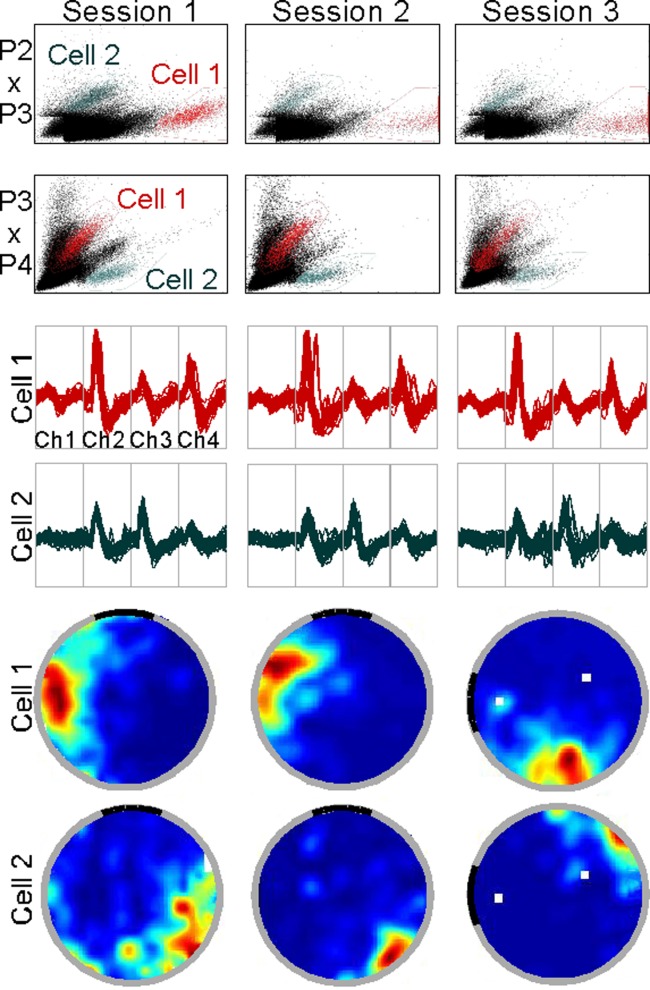
Recording stability was verified across sessions. To accurately determine how counter-rotation of odor and visual cues influenced spatial representations in the hippocampus, it was first essential to demonstrate that the same cells were recorded across all three sessions. As described in the Methods section, pairs of waveform measures were plotted to form clusters of points corresponding to waveforms of individual neurons (A). Boundaries set around clusters in one x–y plot, corresponding for example to peak voltage on channels 2 and 3 of the tetrode (P2 × P3), could be refined on other plots (e.g., P3 × P4). In this way, we isolated the activity of individual neurons [e.g., Cell 1 (in red) and Cell 2 (in green)]. These boundaries set in one session could then be applied to other sessions. With stable recordings, these boundaries faithfully captured the spiking activity of individual neurons over time (B), and made it possible to assess long-term spatial stability and rotation to cues (C). Ch1–4: channels 1–4 of the tetrode. [Color figure can be viewed in the online issue, which is available at http://wileyonlinelibrary.com.]