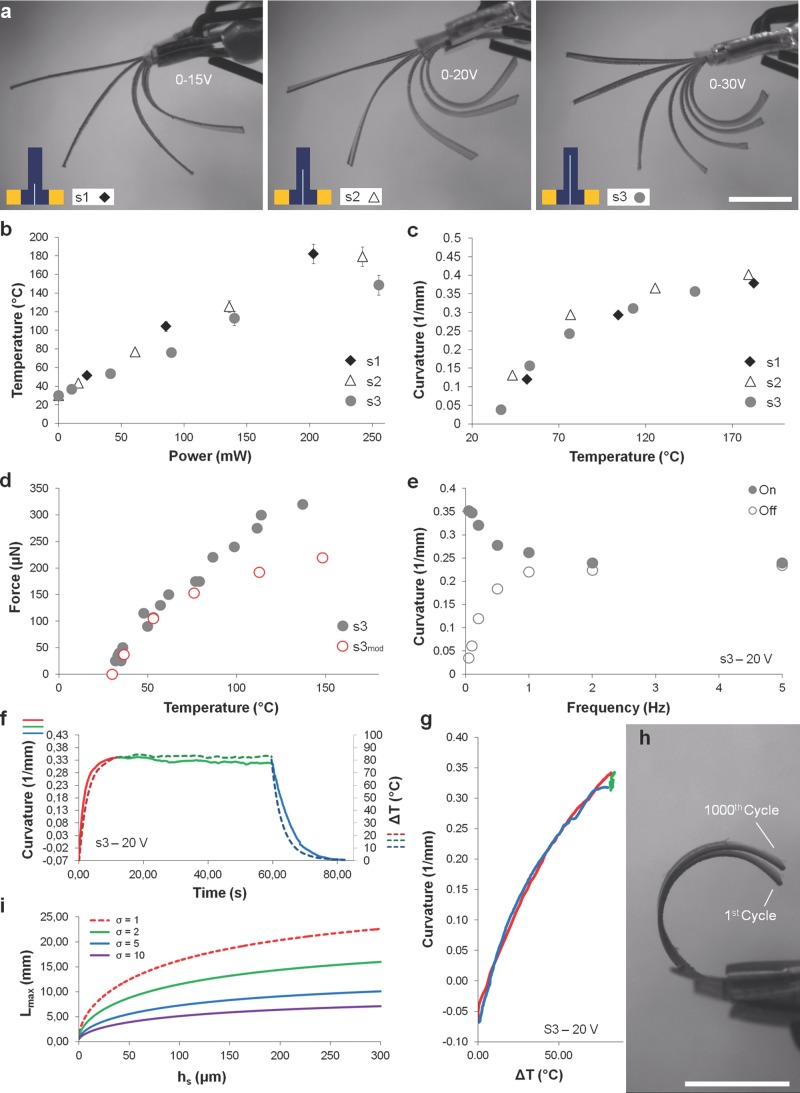
Figure 2.
a) The superpositions of images taken at different input voltages for s1, s2, and s3 highlight the difference between the bending behaviors of the samples. Actuator surface temperature versus applied power. b) and curvature versus temperature c) for the three samples. d) Measured blocking force at different temperatures for sample s3 compared with the theoretical force (s3mod). e) On/Off curvature of sample s3 powered with a square wave voltage with an amplitude of 20 V at different frequencies. Time profiles of surface temperature, curvature. f), and corresponding temperature dependence of curvature g) of sample s3 in response to a step input voltage of 20 V. h) Superposition of images taken for sample s3 before and after 1000 cycles of actuation with a square wave input voltage with a frequency of 0.05 Hz and amplitude of 20 V. All scale bars represent 5 mm. i) Actuator preliminary design chart (example): for a given thickness hs of the PDMS layer, each curve shows the maximum actuator length Lmax that should not be exceeded to ensure Fb > σW, where σ is a targeted value. This chart shows that actuation is more effective for sample lengths that are less than ≈1 cm.

