
Figure 1.
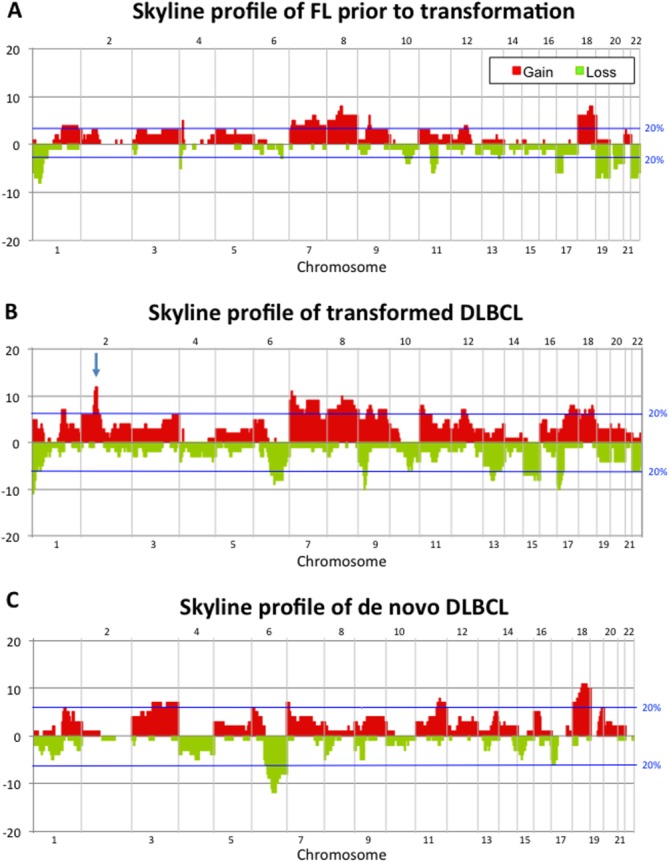
Skyline profiles showing the alterations identified by array-CGH in (A) FL prior to transformation, (B) tDLBCL as well as in (C) dnDLBCL tumors. Gains are indicated in red and losses in green. The blue lines indicate the threshold for alterations identified in at least 20% of the tumors. The arrow in (B) pinpoints 2p amplifications encompassing, among others, the BCL11A and REL-genes. [Color figure can be viewed in the online issue, which is available at http://wileyonlinelibrary.com.]