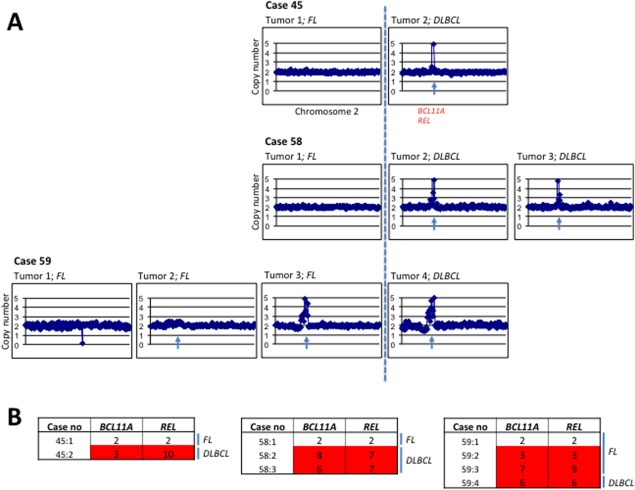
Figure 2.
(A) Array-CGH profiles of chromosome 2 from subsequent tumors from cases 45, 58, and 59 showing progression with high level amplification of 2p15-16, encompassing the BCL11A and REL genes. The dotted line indicates the transformation from FL to tDLBCL. The blue arrow indicates the amplification encompassing the BCL11A and REL genes. (B) qPCR showing copy numbers of BCL11A and REL in the subsequent tumors from cases 45 and 59, respectively. [Color figure can be viewed in the online issue, which is available at http://wileyonlinelibrary.com.]

