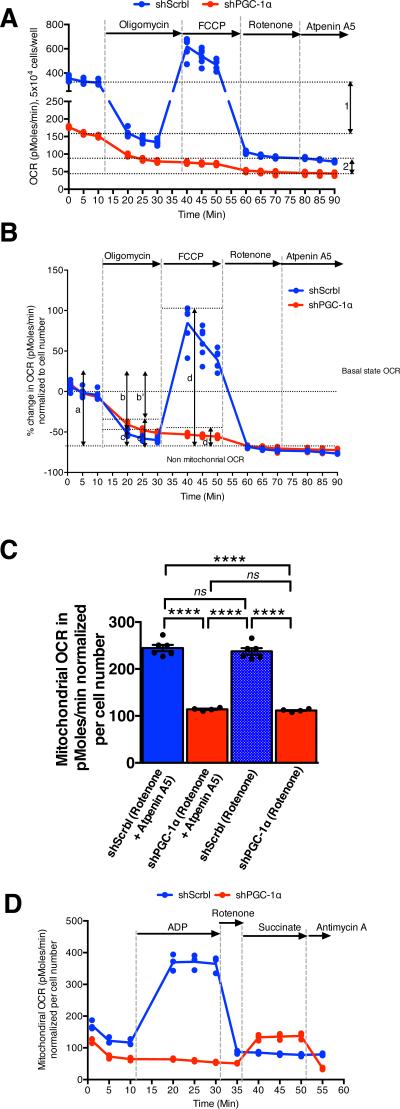
Figure 4. PGC-1α expression modulates complex I-driven oxidative phosphorylation in 4T1 cancer cells.
A. Relative oxygen consumption rate (OCR) normalized to cell number over time in 4T1shPGC-1α (n=4 wells) and 4T1shScrbl (n=6 wells) cells. 1: differential basal state OCR; 2: differential non-mitochondrial OCR. B. Percent change in OCR normalized per cell number in in 4T1shPGC-1α (n=4 wells) and 4T1shScrbl (n=6 wells) cells. a: initial OCR; b and b’: percent OCR used for ATP synthesis in 4T1shScrbl and 4T1shPGC-1α cells respectively; c and c’: percent OCR associated with proton leakage in 4T1shScrbl and 4T1shPGC-1α cells respectively; d and d’: maximum mitochondria respiratory capacity 4T1shScrbl and 4T1shPGC-1α cells respectively. C. Mitochondrial OCR (delta OCR pre and post rotenone with or without atpenin A5 treatment) in 4T1shPGC-1α (n=4) and 4T1shScrbl (n=6 wells) cells, one-way ANOVA. D. OCR measurements in permeabilized 4T1 shScrbl and shPGC1-α cells (n=3 wells per cell line). Data is represented as mean +/− SEM. ns: not significant. * p<0.05, **** p< 0.0001.

