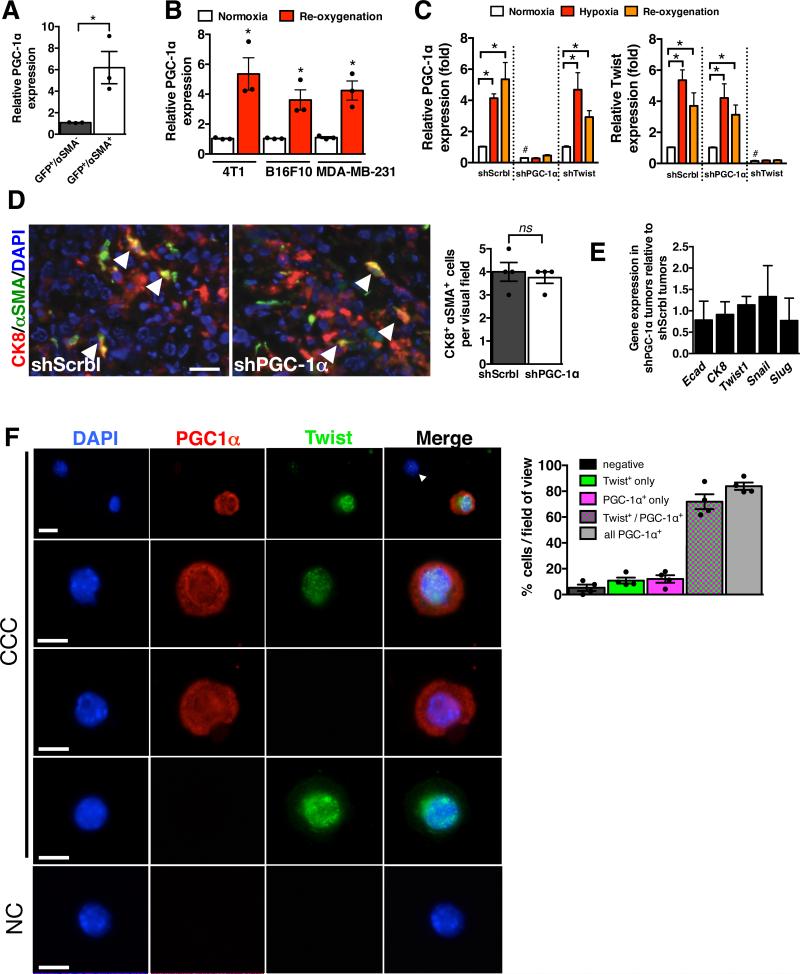
Figure 7. PGC-1α expression is co-induced with an EMT program.
A. PGC-1α expression in FACS purified GFP+/αSMA− and GFP+/αSMA+ cells from 4T1 primary tumor (n=3 RNA samples from FACS purified cells of 3 mice, unpaired two-tailed Student's t-test). * p<0.05. B PGC-1α expression in indicated cells cultured in normoxia and in re-oxygenation (24 hrs) following 48 hrs of hypoxia (n=3 RNA samples/cell line, unpaired two-tailed Student's t-test). * p<0.05. C. PGC-1α and Twist expression in 4T1shScrbl, 4T1shPGC-1α and 4T1shTwist cells cultured in normoxia, hypoxia (48 hrs), and re-oxygened (24 hrs) following 48 hrs of hypoxia (n=3 RNA samples/cell line, unpaired two-tailed Student's t-test). * p<0.05. #: p <0.05 for PGC-1α expression in 4T1shPGC-1α compared to 4T1shScrbl in normoxic condition, and for Twist expression in 4T1shTwist compared to 4T1shScrbl in normoxic condition. D. Representative CK8 (red) and αSMA (green) immunolabeling of the primary tumor. Nuclear staining (DAPI, blue). Arrowheads point to double positive (CK8+/αSMA+) cells. Scale bar: 100 μm. Bar graph: quantitation of number of CK8+/αSMA+ cells per field of view (n=4 stained slides of tumors from 4 mice, unpaired two-tailed Student's t-test). E. Relative expression of indicated genes in 4T1shPGC-1α tumors normalized to 4T1shScrbl tumors (n=5 RNA samples from tumors of 5 mice, unpaired two-tailed Student's t-test). F. Immunolabeling of cytopsin of 4T1 CCC for Twist and PGC-1α (n=4 mice). Scale bar: 10μm. NC: negative control, secondary antibody used only. Bar graph: Relative percentage of CCC negative for both Twist and PGC-1α, positive for Twist only (PGC-1α−), positive for PGC-1α only (Twist−), positive for both Twist and PGC-1α, and all PGC1a positive CCC (regardless of Twist status). Scale bars: 25μm (upper panel), 10μm (lower panel). Data is represented as mean +/− SEM. ns: not significant.

