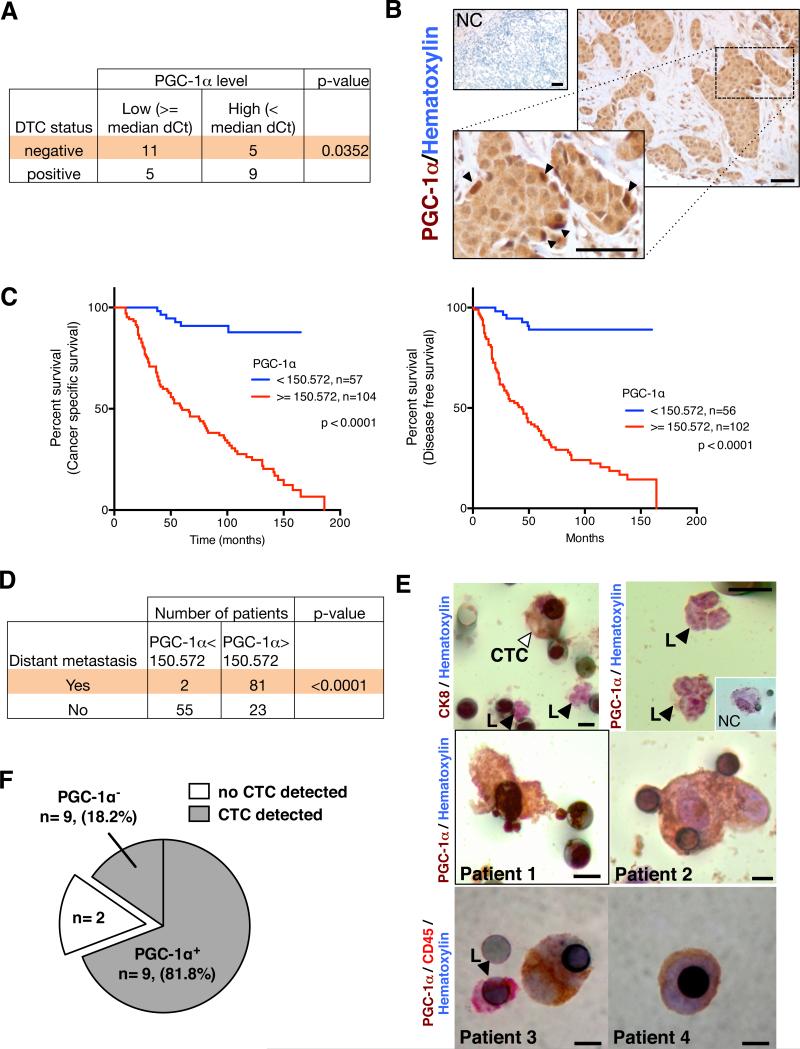
Figure 8. PGC-1α expression in circulating cancer cells correlates with invasion and distant metastasis in patients with IDC.
A. Correlation of relative PGC-1α expression (median dCt value used as cut-off) in laser dissected neoplastic cells from resected tumors of patients with IDC and status of disseminated tumor cells (DTC) in the bone marrow (BM+: bone marrow is positive for DTC; BM−: bone marrow is negative for DTC). BM+ status, n=16 RNA samples from 16 patients; BM−status, n=14 RNA samples from 14 patients. (Supplementary Table 1, one-sided χ2 analysis). B. Immunohistochemistry staining for PGC-1α (haematoxylin counter stain) in breast tumors from patients with IDC. NC: negative control, secondary antibody and haematoxylin counter stain only. Arrowheads in zoomed-in insert point to the strongly positive PGC-1α cells found on the invasive edge. Scale bar: 50μm. C. Cancer specific survival and disease free survival of IDC patients grouped based on PGC-1α expression (Supplementary Table 2, log-rank test). D. Correlative analysis of the number of IDC patients with and without distant metastases categorized based on the indicated PGC-1α expression threshold (Supplementary Table 2, Fisher's exact test). Kaplan-Meier curves were drawn and differences between the curves were calculated by the log-rank test. E. Circulating cancer cell (“CTC”, right arrowhead) stains for the epithelial marker CK8, while leukocytes (“L”, left arrowhead) are negative for CK8 (upper left panel). Leukocytes are negative for PGC-1α (upper right panel). Insert shows (NC) negative control staining of a CTC (secondary antibody only). PGC-1α (patient 1 and 2) or CD45 and PGC-1α (patient 3 and 4) immunostaining of CTC (lower panels, Supplementary Table 3). Scale bar: 8μm. F. Representation of the PGC-1α+ CTC status evaluated by immunohistochemistry staining in IDC patients with lung metastasis (Supplementary Table 4).

