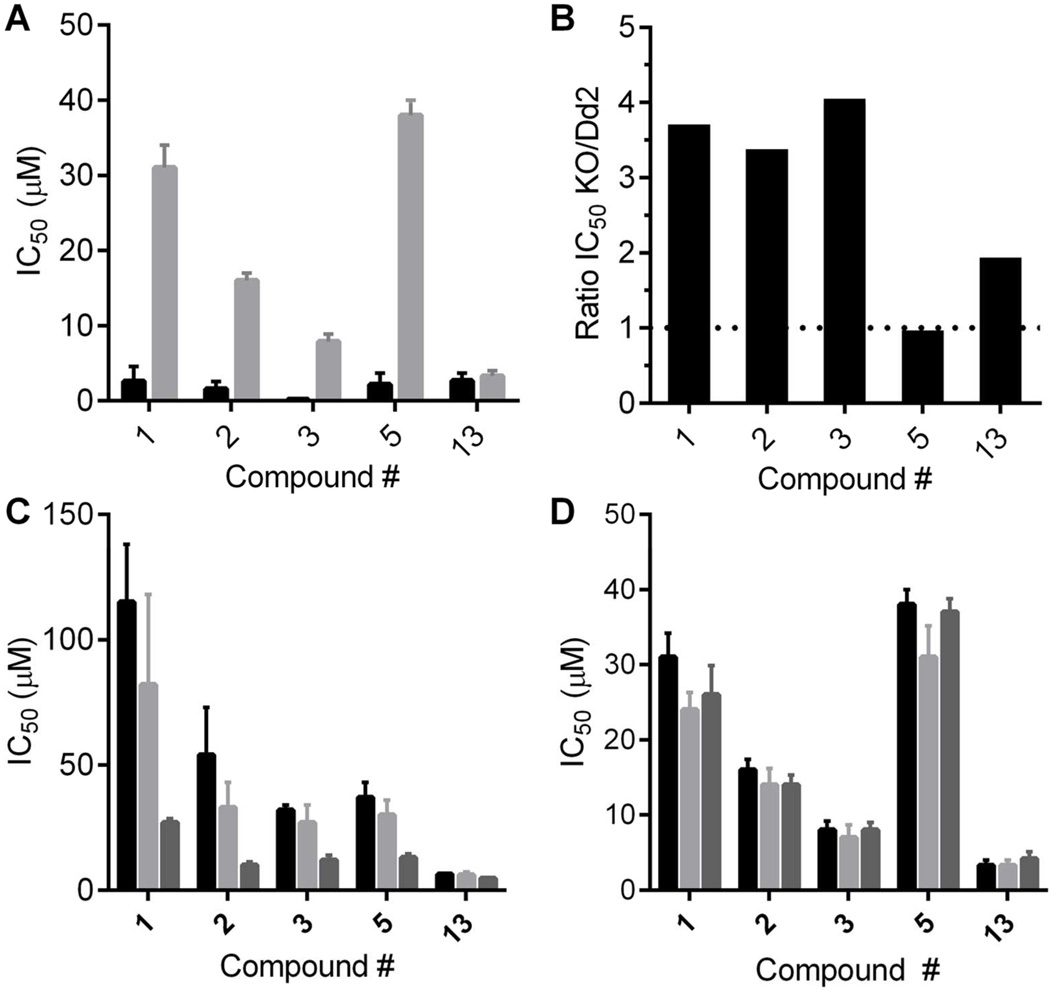
Figure 4.
Efficacy target validation for parasitocidal effects of PfENT1 inhibitors. (A) IC50 values for five PfENT1 inhibitor compounds, one from each chemotype, with either 10 µM hypoxanthine (gray bars) or 90 µM xanthine (black bars) as the sole purine source in the media. Mean ± SD shown. (B) Ratio of the IC50 value in pfent1Δ parasites to the IC50 value in WT Dd2 parasites for the five compounds. Dashed line indicates a ratio of 1, no difference in the IC50 values. (C, D) IC50 values for the effects of the five compounds on (C) pfent1Δ and (D) WT Dd2 parasites measured 48 (black bars), 72 (light gray bars) and 96 (dark gray bars) h after application of compound. Note the progressive decrease in the IC50 values with time for pfent1Δ but not for Dd2 parasites. Mean ± SD (n=3).

