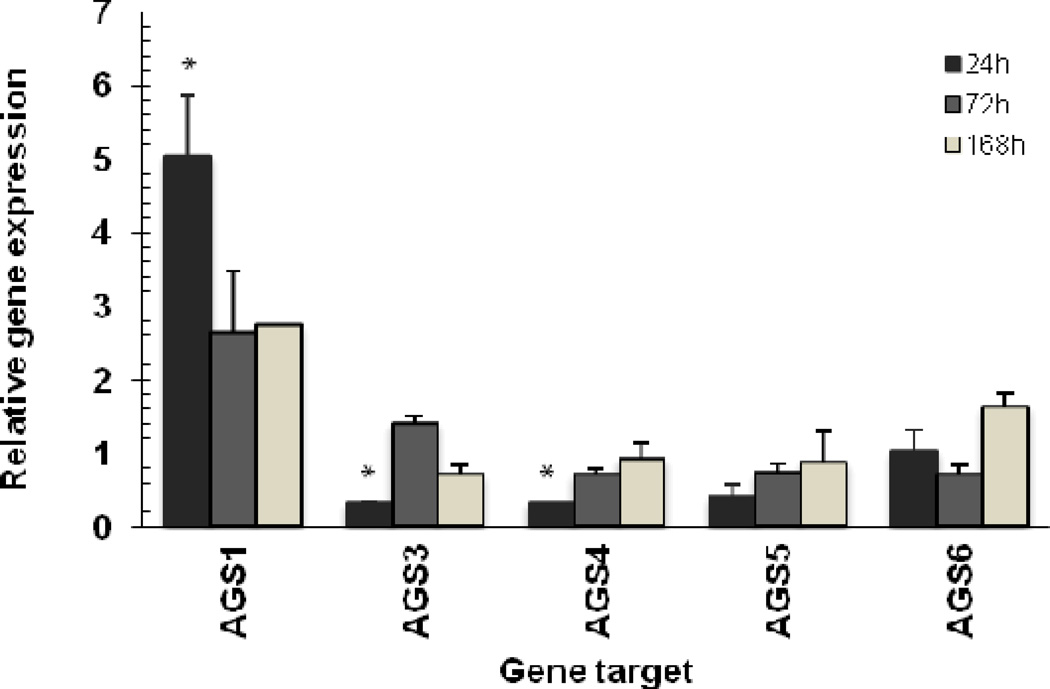
Figure 2.
Quantitative RT-PCR analysis of Group I and II AGS gene expression in normal and ischemia-reperfusion injured rat kidneys. Relative gene expression was determined by the AACT method using 18S RNA level for normalization. Data is shown as mean ± STD. Statistical analysis was performed on ACT values to compare gene expression between injured (n=5) and sham (controls) groups (n=5). * P<0.05 was considered significant.

