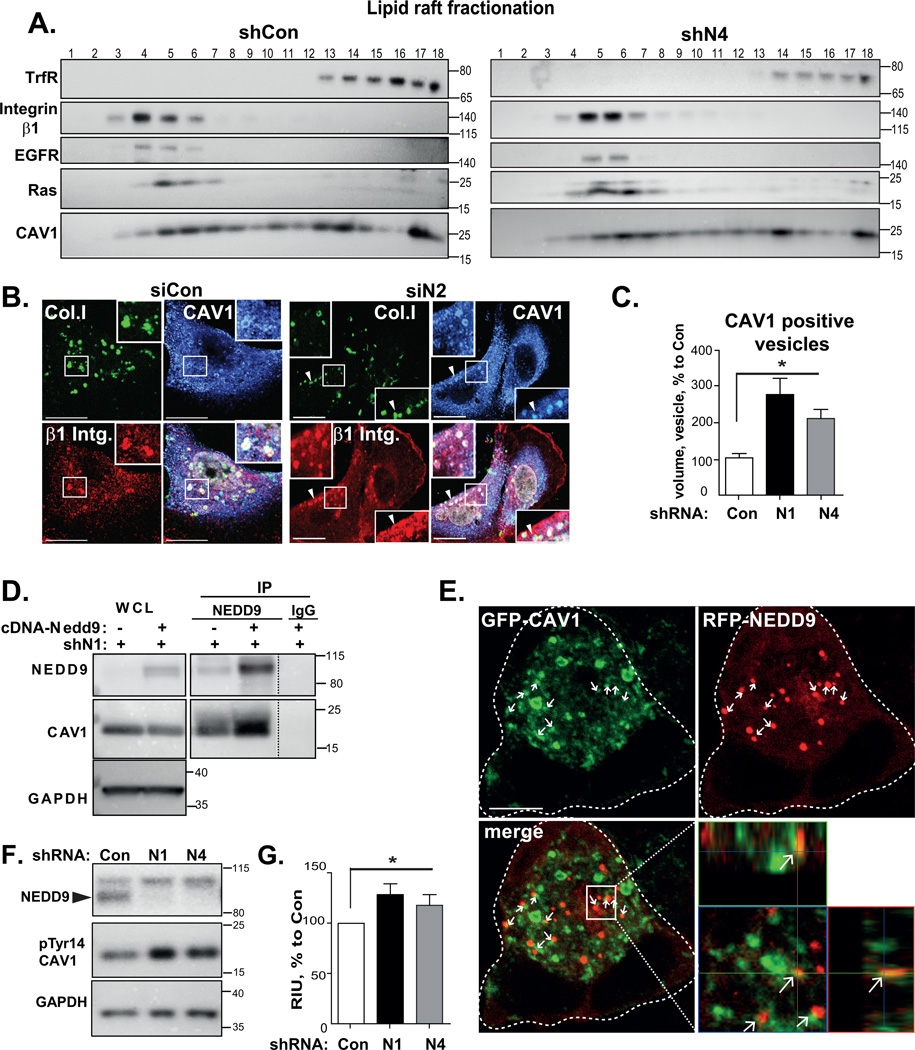
Figure 6. NEDD9 binds to and modulates activity of CAV1.
(A) WB analysis of lipid raft fractionation, MDA-MB-231-shCon, -shN4 cells with anti-β1 integrin, -transferin receptor (TrfR), -EGFR, -Ras and CAV1 antibodies. (B) 3D reconstructed confocal images of MDA-MB-231-siCon, -siN2 cells; FITC-collagen I (green), β1 integrin (red), CAV1 (blue); Scale bar, 20µm; inserts-the enlarged areas of individual cells (white lines) indicated in the main panel. (C) Quantification of volume of CAV1-positive vesicles; MDA-MB-231-shCon and -shN1, -N4 cells based on 3D reconstructed confocal immunofluorescent images with anti-CAV1-Ab; mean volume (%) normalized to shCon+SEM; n=3, 10 cells/treatment; one-way ANOVA: *p<0.02 for shCon/shN1 or /shN4. (D) WB analysis of WCL and immunoprecipitated (IP) NEDD9 with anti-NEDD9, CAV1 and GAPDH antibodies; MDA-MB-231-shN1 cells; rescue with cDNA-Nedd9, non-specific IgG – control. (E) Confocal images of MDA-MB-231 cells transfected with RFP-NEDD9 (red); GFP-CAV1 (green). Scale bar, 10µm; insert is the enlarged area as indicate by white rectangle; dotted lines outline cell borders; white arrows-RFP-NEDD9 co-localizes with GFP-CAV1. (F) WB of MDA-MB-231-shCon and -shN1,-N4 cells with anti-pTyr14-CAV1, -NEDD9 and -GAPDH antibodies. (G) Quantification of WBs as in (F), n=3, RIU (%) to shCon+SEM; one-way ANOVA *p<0.03 shCon/shN1/or shN4.

