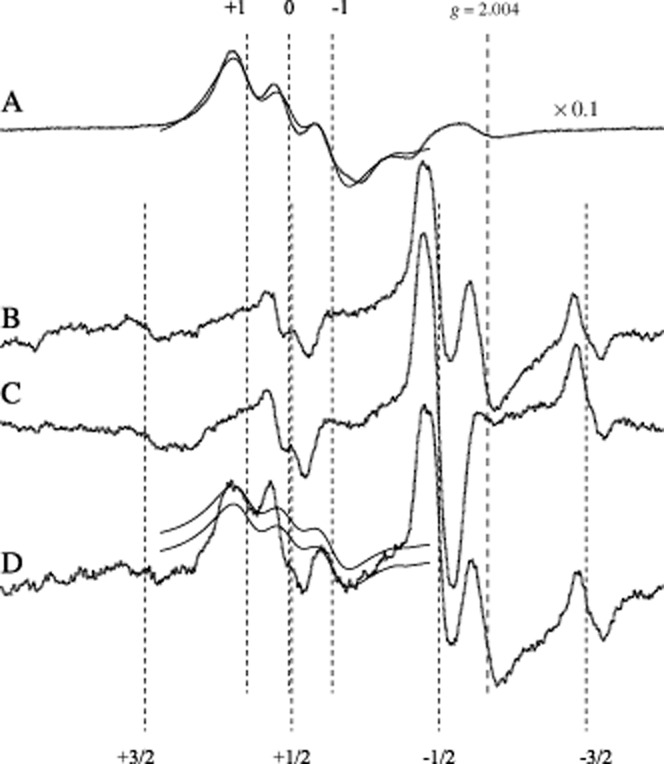
Figure 2.

X-band EPR spectra of NO-Fe2+(DETC)2 complex in left ventricular tissue samples of rat hearts. Trace A: dotted line, positive control (NO donor sodium nitroprusside), with gain reduced by a factor of 10 compared with curves B–D; solid line, sum of Lorentzians fitted to the NO signal. Trace B: background spectrum, Cu2+(DETC)2. Trace C: negative control (NOS inhibitor NG-nitro-L-arginine). Trace D: increased NO production in nitroglycerine-tolerant animals. The solid lines on trace D are the fitted spectrum from trace A, but scaled down to match the +1 and −1 hyperfine lines, upper and lower solid lines, respectively, of the NO spectral component of the spectrum. The +1, 0, −1 numbers indicate the hyperfine lines of NO-Fe2+(DETC)2 triplet (perpendicular orientation). The +3/2, +1/2, −1/2, −3/2 numbers indicate the hyperfine lines of Cu2+(DETC)2 (perpendicular orientation). Sample temperature was 160 K, central field and scan range are 335.6 and 34.0 mT respectively. The g = 2.004 position of the g-value was determined using a g standard.
Figure was modified with permission from Csont et al. (1998).
