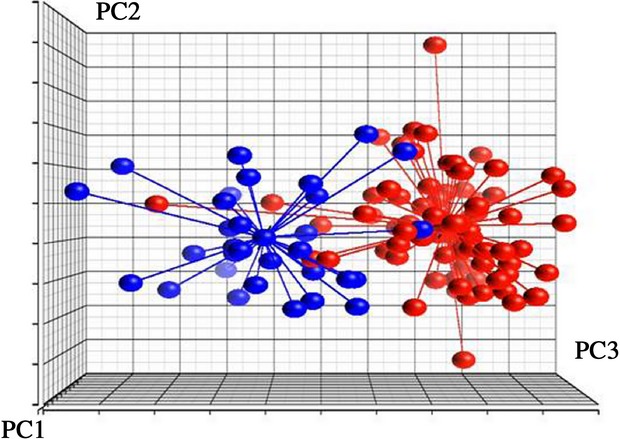
Figure 2.

Principal component analysis (PCA) based on 42 gene-transcripts of the diagnostic classifier. This difference between MS and NonMS patients from training set is presented. Each dot represents patient sample principal components derived from expression of 42 diagnostic classifier gene-transcripts. The distance between any pair of points is related to the similarity between the two observations in high-dimensional (3D) space. Blue dots represent NonMS patients, Red dots represent MS patients.
