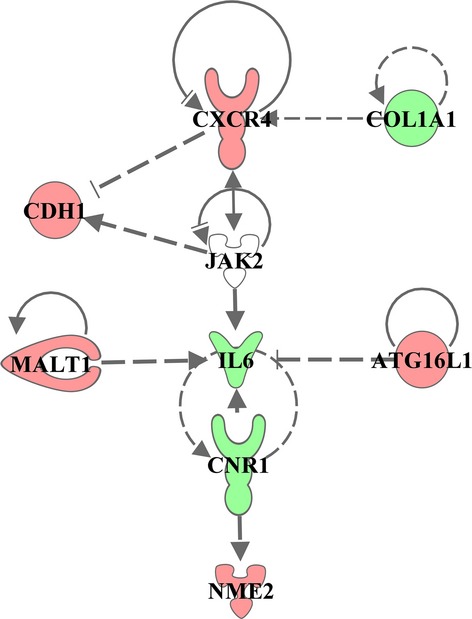
Figure 3.

Functional regulatory network of classifier genes. Classifier gene network reconstructed based on literature-known relationships according to IPA software database. Each node in the regulation tree represents a regulating gene, arrows indicate literature confirmed regulatory interactions. Over-expressed genes are depicted in red, down-expressed in green.
