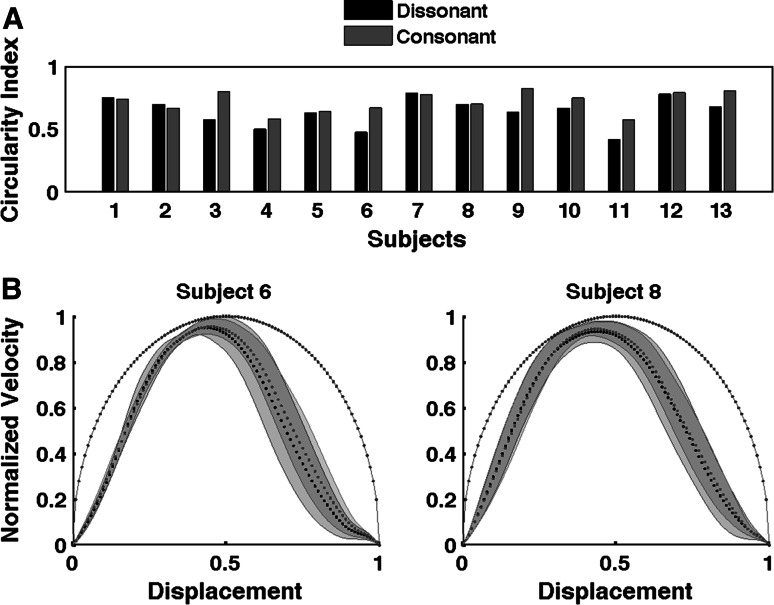
Fig. 7.
a Average circularity index for all 13 participants for both consonant and dissonant conditions during the continuation phase. b Averaged data from two participants (6 and 8) when moving with consonant and dissonant metronomes during the continuation phase. The averaged normalized velocity profile plotted against normalized displacement, and shaded regions around the velocity profiles represent error bars (SEM). For subject number 6, movements are more circular in form for consonant (red dots) than dissonant intervals (black dots), while subject number 8 showed a similar pattern of movement circularity for both intervals. The blue dots indicate the velocity profile of a perfect sinusoidal movement (color figure online)

