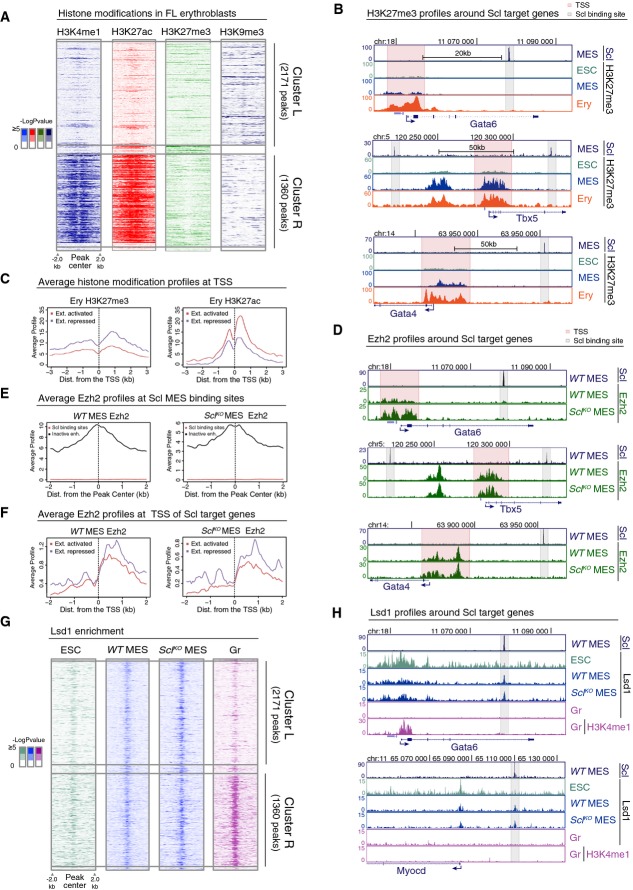
Figure 4.
- Heatmaps of H3K4me1, H3K27ac, H3K27me3 and H3K9me3 histone modifications in FL erythroblasts around Scl MES binding sites in cluster L and cluster R show no gain of common repressive histone marks in cluster L.
- H3K27me3 ChIP-seq tracks in ES cells (ESC), Flk1+ mesoderm (MES) and FL erythroblasts (Ery) show that cardiac genes Gata6, Tbx5 and Gata4 harbor H3K27me3 at the TSS (pink) but not at Scl binding sites (gray).
- Average H3K27me3 (left) and H3K27ac (right) levels in FL erythroblasts around the TSS of extended list of Scl activated and repressed genes show that Scl repressed genes have on average more H3K27me3 and less H3K27ac as compared to Scl activated genes.
- Ezh2 ChIP-seq tracks in WT and SclKO mesoderm showing that Ezh2 recruitment to the TSS of cardiac genes Gata6, Tbx5 and Gata4 is not Scl dependent.
- Average Ezh2 enrichment in WT (left) and SclKO mesoderm (right) for inactive enhancers (defined by having H3K4me1 and H3K27me3 modifications (Wamstad et al, 2012) and distance greater than 5 kb from TSS) and for Scl binding sites shows no Ezh2 enrichment at Scl binding sites.
- Average Ezh2 enrichment at the TSS of extended list of Scl activated and repressed genes is similar in WT (left) and SclKO mesoderm (right).
- Heatmaps of Lsd1 enrichment in ES cells, WT and SclKO mesoderm and in granulocytes (Gr) (Kerenyi et al, 2013) in cluster L and cluster R show co-localization of Lsd1 binding with Scl binding sites and reveal that recruitment of Lsd1 can happen independently of Scl.
- Lsd1 ChIP-seq tracks (ES cells, WT and SclKO Flk1+ mesoderm and granulocytes) and H3K4me1 ChIP-seq track (granulocytes) show that Lsd1 enrichment coincides with Scl MES binding sites nearby cardiac genes Gata6 and Myocd in WT and SclKO Flk1+ mesoderm.

