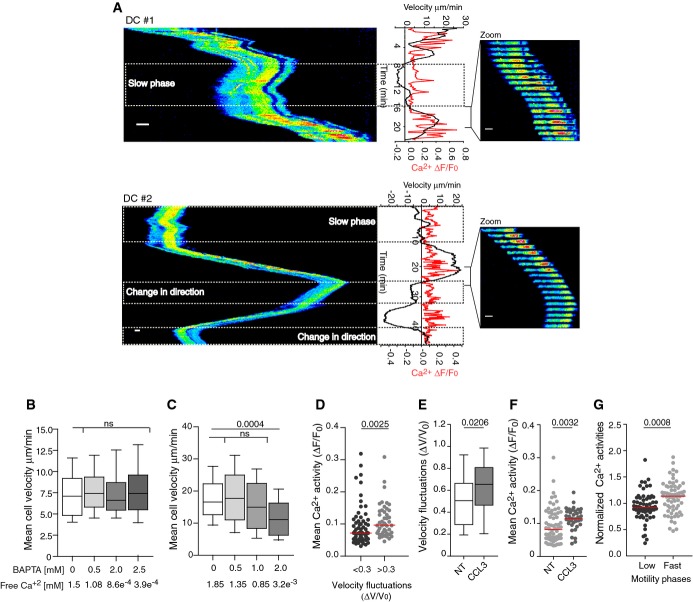
Figure 1.
- A Left, kymograph from sequential epifluorescence (20×) images showing cytosolic Ca2+ oscillations in speed-fluctuating immature DC after slow motility phases (upper and lower panel) and a change in direction (lower panel). DCs were loaded with the Ca2+ dye Oregon Green BAPTA 1-AM, introduced in micro-channels, and imaged every 10 s. Right, sequential epifluorescence (20×) images (1 image/20 s is shown). Instantaneous velocities and intracellular calcium oscillations were measured as described in Materials and Methods. Scale bar: 10 μm.
- B, C Mean cell velocity of immature DCs (n > 125 cells from two independent experiments) (B) or CD8+ T lymphocytes (n > 40 cells from one experiment) (C) migrating in micro-channels with or without BAPTA. Boxes illustrate 10–90 percentiles of values, and whiskers represent the range of values. P-values were calculated using a Kruskal–Wallis test.
- D Mean intracellular calcium concentration in speed-fluctuating (ΔV/V0 > 0.3; ΔV/V0 relative speed variation divided by the global median velocity) and non-speed-fluctuating (ΔV/V0 < 0.3) immature DCs (n = 187 cells from more than three independent experiments). P-values were calculated using a Mann–Whitney test.
- E, F Velocity fluctuations (ΔV/V0) (E) or mean Ca2+ activities (F) displayed by DCs migrating in micro-channels in the presence of 100 ng/ml CCL3. P-values were calculated using a Mann–Whitney test, with respect to non-treated DCs (NT).
- G Mean Ca2+ activities during phases of fast (> 50% of max velocity) and slow (< 50% of max velocity) motility in speed-fluctuating DCs (Supplementary Fig S2F) (n = 64 cells, from three independent experiments). Activities were normalized to the mean Ca2+ activity shown by each cell during the entire movie. The P-value was calculated using a Mann–Whitney test.

