
Figure 2.
IP3 receptors are required for dendritic cell fast migration
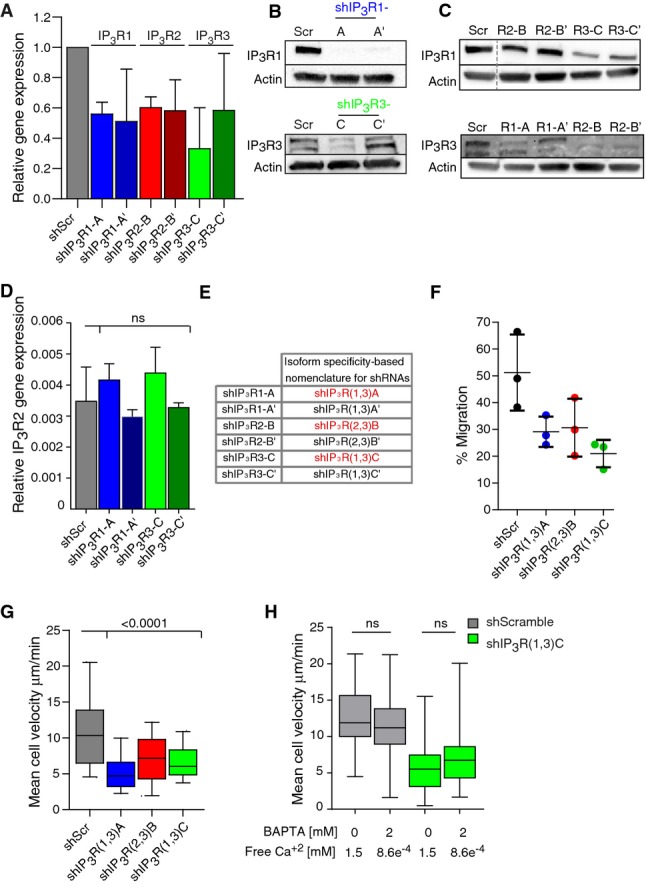
- Relative gene expression of IP3R1 (blue), IP3R2 (red), and IP3R3 (green) in IP3R-silenced DCs. DCs were infected with two lentiviruses encoding for different shRNAs for IP3R isoforms. ShScramble-infected DCs were used as a control. Gene expression was determined by a quantitative PCR. It was calculated with respect to GAPDH expression and normalized to the levels observed in the shScramble. The median plus standard deviation of three independent experiments are shown.
- Immunoblot for IP3R type 1 and IP3R type 3 in IP3R-silenced DCs. Actin was used as a control. IP3R3 appears as two bands as previously described (22).
- Immunoblot for IP3R type 1 (top) and IP3R type 3 (bottom) in DCs transduced with lentivirus encoding for different IP3R shRNAs. Actin was used as a control.
- Relative IP3R2 expression in ShScramble-infected DCs (gray), shIP3R1 (blue), and IP3R3 (green)-silenced DCs. The experiment was performed as described in (A).
- Table showing the nomenclature for shRNAs related to their isoform-specific silencing. The shRNAs chosen to pursuit this study are highlighted in red.
- Transmigration assay of shScramble-, IP3R(1,3)A (blue)-, IP3R(2,3)B (red)-, and IP3R(1,3)C (green)-expressing DCs. Cells were loaded in the upper chamber of a 5-μm pore collagen-coated transwell assay, recovered from the upper and lower chambers after 16 h, and counted. The median from three independent experiments is shown.
- Quantification of the mean cell velocity of shIP3R(1,3)A (blue)-, shIP3R(2,3)B (red)-, and shIP3R(1,3)C (green)-silenced immature DCs migrating in micro-channels. shScramble-infected DCs were used as a control (gray) (n > 100 cells from three independent experiments for shIP3R(1,3)A and shIP3R(1,3)C and two independent experiments for shIP3R(2,3)B). Boxes illustrate 10–90 percentiles of values, and whiskers represent the range of values. P-values were calculated using a Kruskal–Wallis test.
- Quantification of the mean cell velocity of shIP3R(1,3)C (green)-silenced immature DCs migrating in micro-channels in the presence of 2 mM BAPTA. shScramble-infected DCs were used as a control (gray) (n > 70 cells from two independent experiments). P-values were calculated using a Kruskal–Wallis test.