
Figure 2.
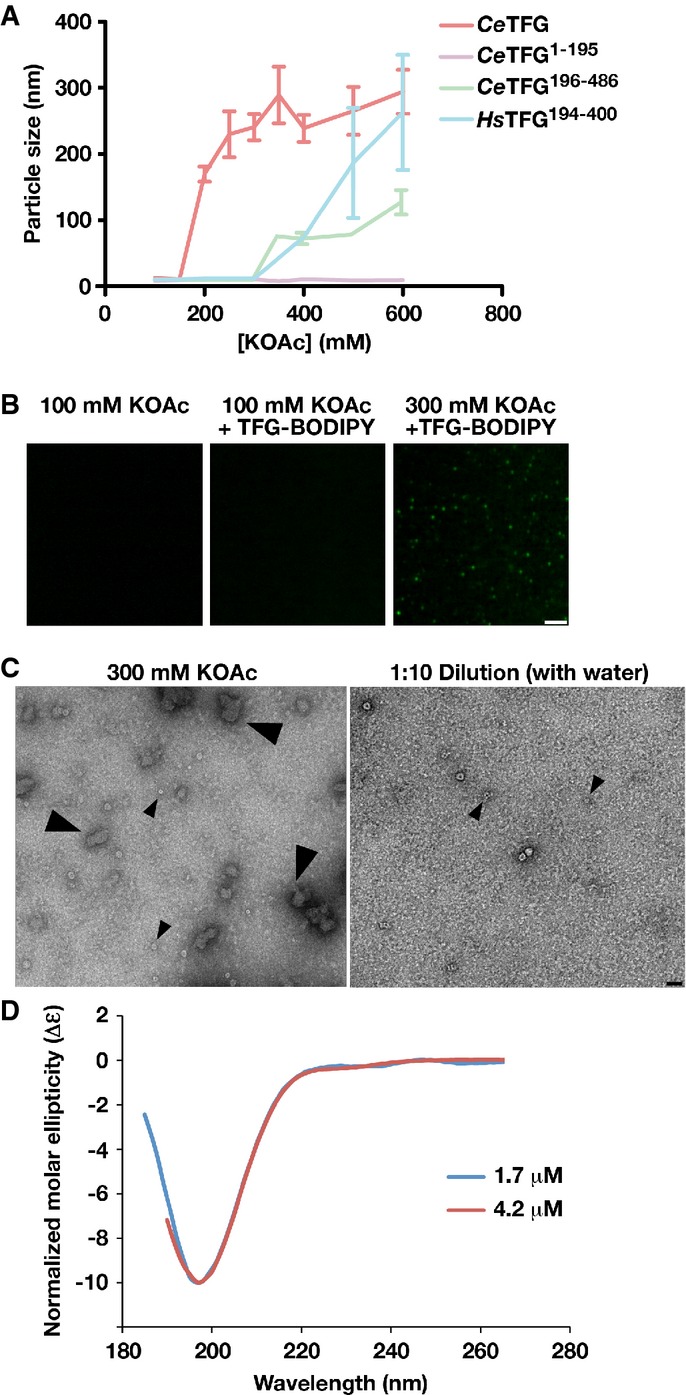
The PQ-rich domain of TFG facilitates its further polymerization
- TFG particle size was determined using dynamic light scattering under increasing potassium acetate concentrations. Error bars represent mean ± SEM; n = 10 replicates.
- Confocal images of recombinant, BODIPY-labeled TFG in the presence of varying potassium acetate concentrations. Scale bar, 2 μm.
- Recombinant TFG in the presence of varying potassium acetate concentrations was imaged by negative stain-EM. Large arrowheads highlight TFG polymers (only found in the presence of elevated potassium acetate). Small arrowheads highlight individual 11 nm cup-like TFG octamers. Scale bar, 30 nm.
- Circular dichroism spectroscopy was used to characterize the carboxyl-terminus of C. elegans TFG (amino acids 195-486). Samples were analyzed at different concentrations, and the data were normalized relative to one another. CD spectra were collected at 25°C in 25 mM sodium phosphate (pH 7.2) using a 1 mm path length quartz cell. The spectra are characteristic of an intrinsically disordered protein.