
Figure 5.
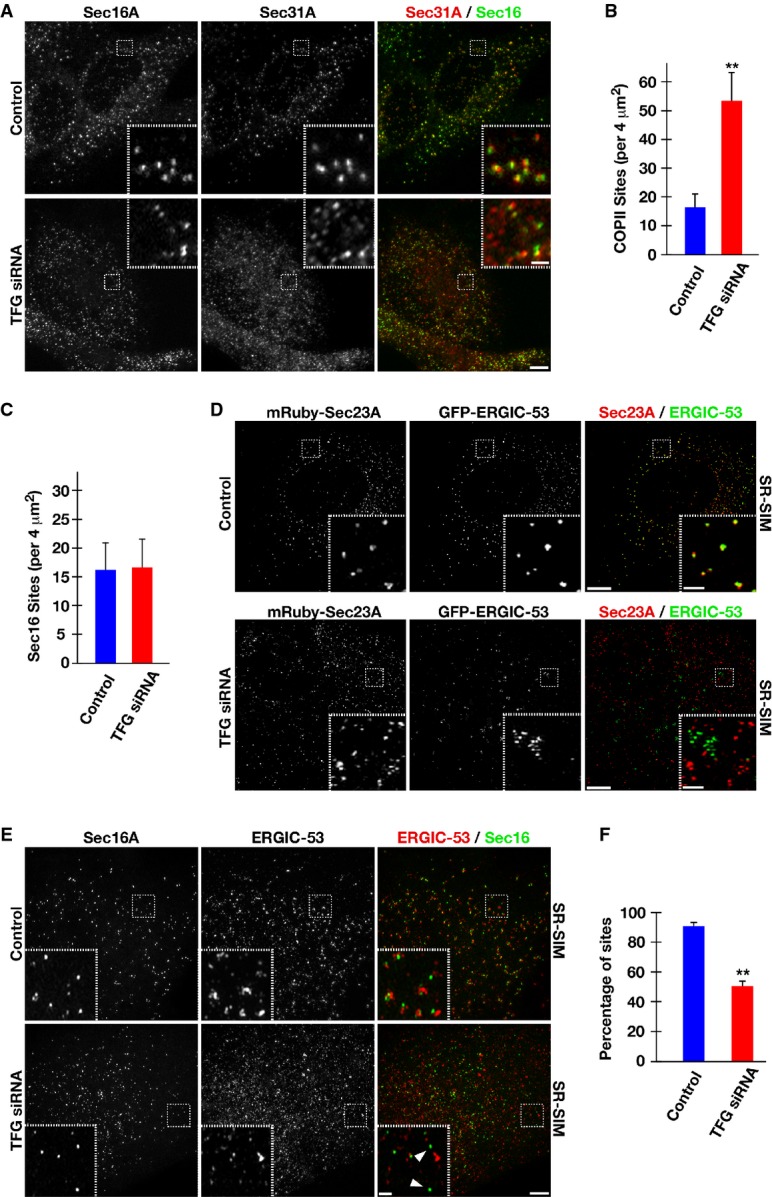
TFG depletion disrupts early secretory pathway organization
- Human RPE-1 cells were mock-transfected (control) or transfected with a TFG siRNA for 60 h. Cells were fixed and stained using α-Sec16A and α-Sec31 antibodies and imaged using confocal microscopy. Images shown are projections of 3D data sets (4 μm in z). Both individual and merged images with Sec16A in green and Sec31A in red are shown (at least 15 cells for each condition). Scale bar, 5 μm. Higher magnification views of the indicated regions (boxed) are also shown in the lower or upper right portion of each image. Inset scale bar, 1 μm.
- Quantification of the number of Sec31A-labeled structures in a 4 μm2 region. For both conditions (control or TFG siRNA-treated), at least 50 distinct regions away from the peri-nuclear Golgi were examined. Error bars represent mean ± SEM; at least 15 different cells per condition. **P < 0.01 compared with control, calculated using a paired t-test.
- Quantification of the number of Sec16A-labeled structures in a 4 μm2 region. For both conditions (control or TFG siRNA-treated), at least 50 distinct regions away from the peri-nuclear Golgi were examined. Error bars represent mean ± SEM; at least 15 different cells per condition. No statistically significant difference was observed, following analysis using a paired t-test.
- Cells stably expressing low levels of GFP-ERGIC-53 and mRuby-Sec23A were fixed and imaged using SR-SIM (top), or depleted of endogenous TFG prior to fixation and SR-SIM imaging (bottom). Images shown are representative of at least 15 individual cells analyzed for each condition. Scale bar, 5 μm. Inset scale bar, 1 μm.
- Human RPE-1 cells were mock-transfected (control) or transfected with a TFG siRNA for 60 h. Cells were fixed and stained using α-Sec16A and α-ERGIC-53 antibodies and imaged using SR-SIM. Images shown are projections of 3D data sets (4 μm in z). Both individual and merged images with Sec16A in green and ERGIC-53 in red are shown (at least 15 cells for each condition). Scale bar, 5 μm. Higher magnification views of the indicated regions (boxed) are also shown in the lower or upper right portion of each image. Arrowheads highlight Sec16A-labeled structures that do not exhibit juxtaposed ERGIC-53 staining. Inset scale bar, 1 μm.
- Based on structured illumination microscopy, quantification of the number of Sec16A-labeled structures juxtaposed (within 500 nm) to ERGIC-53-labeled structures is shown. For both conditions (control or TFG siRNA-treated), at least 1,000 unique Sec16A-labeled structures were examined. Error bars represent mean ± SEM; at least 15 different cells per condition. **P < 0.01 compared with control, calculated using a paired t-test.