
Figure 6.
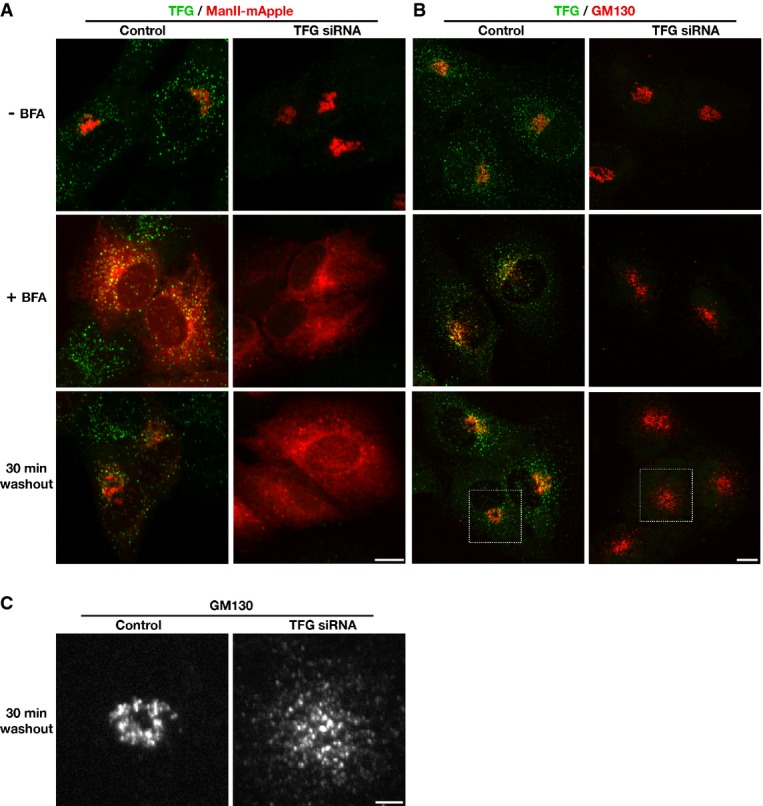
TFG depletion delays de novo Golgi assembly
- Human RPE-1 cells stably expressing low levels of mannosidase II-mApple (ManII-mApple) were mock-transfected (control) or transfected with a TFG siRNA for 60 h, then fixed and stained using TFG antibodies and imaged using confocal microscopy. Alternatively, cells were either treated with DMSO (top row) or brefeldin A (BFA) for 1 h (middle row), followed by fixation, or washed into fresh media following DMSO or BFA treatment for 30 min (bottom row), prior to fixation. Images shown are projections of 3D data sets (4 μm in z). Merged images with TFG in green and ManII in red are shown. Scale bar, 5 μm. Images shown are representative of at least 10 individual cells analyzed for each condition.
- Human RPE-1 cells were mock-transfected (control) or transfected with a TFG siRNA for 60 h, then fixed and stained using TFG and GM130 antibodies and imaged using confocal microscopy. Alternatively, cells were either treated with DMSO (top row) or brefeldin A (BFA) for 1 h (middle row), followed by fixation, or washed into fresh media following DMSO or BFA treatment for 30 min (bottom row), prior to fixation. Images shown are projections of 3D data sets (4 μm in z). Merged images with TFG in green and GM130 in red are shown. Scale bar, 5 μm. Images shown are representative of at least 10 individual cells analyzed for each condition.
- Higher magnification views of the indicated regions in (B, boxed) are shown (GM130 distribution only). Scale bar, 2 μm.