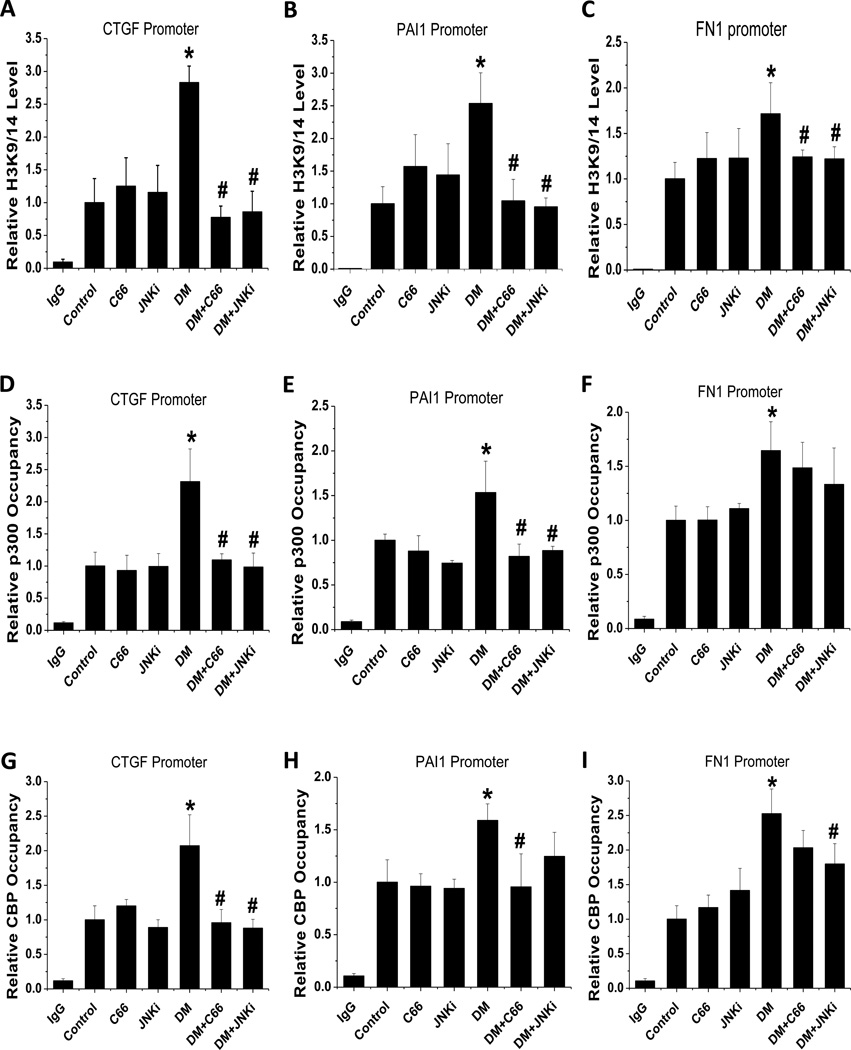
Figure 7. C66 produced a persistent decrease in the diabetes-induced increase in renal H3K9/14 levels on the promoters of CTGF, PAI-1 and FN-1 genes.
CHIP assay was used to detect the (A, B, C) H3K9/14 levels and (D, E, F) p300 occupancy on the (A) CTGF, (B) PAI-1 and (C) FN-1 promoters at 6 months after treatment (equating to 3 months after treatment termination). Normal mouse IgG was used as a negative control and data were normalized to input DNA samples. n=5; * P < 0.05 vs. control group; # P < 0.05 vs. DM group.

