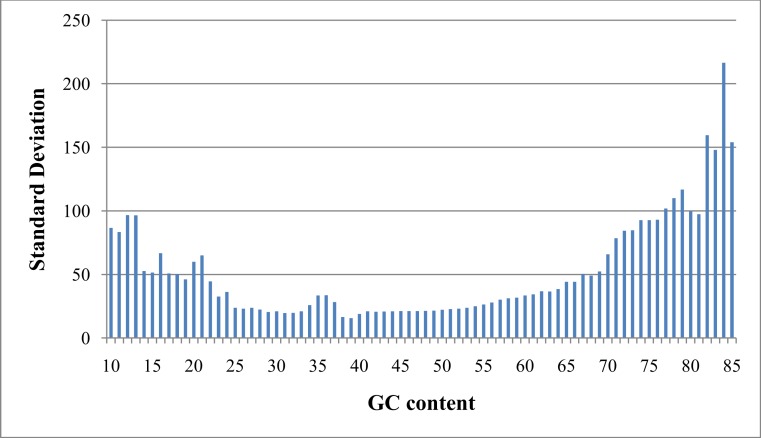
Figure 2. Standard deviation after GC bias normalization.
Data produced from chromosome 19 of NA12878 (Illumina high coverage paired-end read dataset aligned with BWA to human reference hg18) (DePristo et al., 2011) using 100-base non-overlapping windows. Reads were assigned to a window if the read center was within the window. After correcting for GC bias using a common approach, the standard deviation varies with GC content. This negatively impacts further analysis by CNV detection algorithms.

