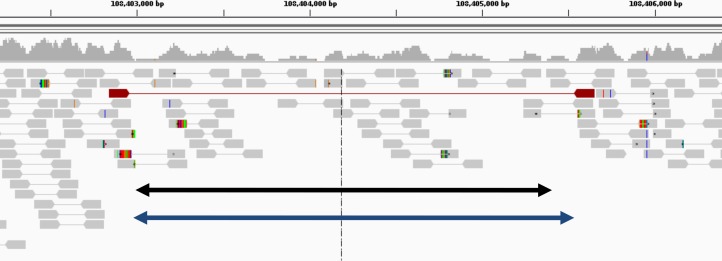
Figure 6. Example of deletion in chromosome 1 of NA12878 (detected only by GROM-RD in the low coverage dataset).
Histogram at the top reflects read coverage across the region. Grey pointed rectangles connected by lines represent paired reads. Gold standard validation (108402984–108405403) and GROM-RD’s prediction (108402966–108405569) are represented by the black and blue double-arrowed lines, respectively. CNVnator and RDXplorer did not predict the deletion. We note that deletions in low coverage datasets are difficult for any method to detect as evidenced by only one discordant read pair (red pointed rectangles connected by red line) supporting the deletion making detection unlikely by a PR method. Example is shown using human reference hg19 in IGV viewer (Robinson et al., 2011).

