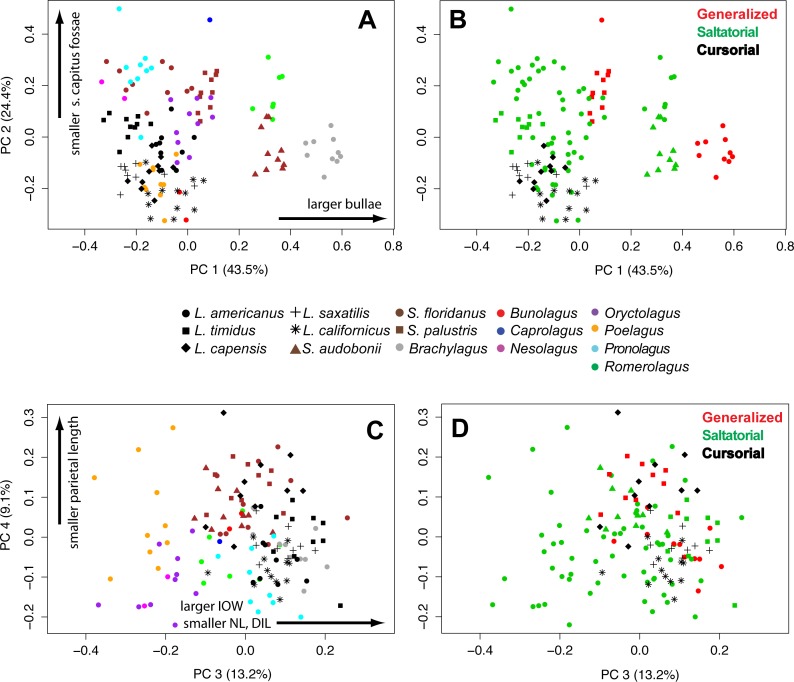
Figure 6. Multivariate PCAs.
Principal components analysis of 10 log-shape ratios measurements describing cranial shape for all specimens. Biplots show PC1 vs PC2 (top) and PC3 vs PC4 (bottom). (A) Colored symbols by species. (B) colored by LOC (with species symbols). Details of the loadings of each variable in the PCA are presented in Table 3.

