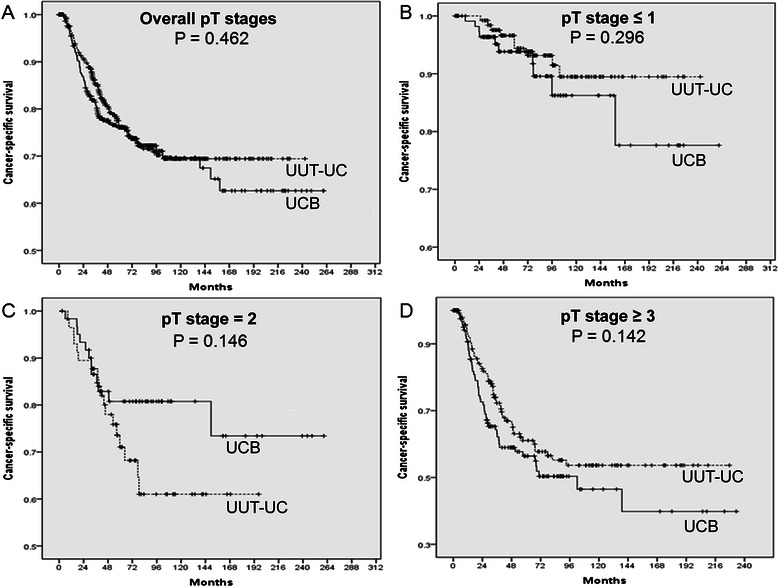
Figure 3.

Kaplan–Meier curves for cancer-specific survival (CSS) in patients with upper urinary tract urothelial carcinoma (UUT-UC) and urothelial carcinoma of bladder (UCB). Between UUT-UC and UCB groups, no significant in 5 year-CSS rates were observed in (A) overall pathologic T stages (76.1% vs. 76.2%, p = 0.462), (B) pathological T stage ≤ 1 (94.4% vs. 93.8%, p = 0.296), (C) pathological T stage = 2 (71.0% vs. 80.8%, p = 0.146), and (D) pathological T stage ≥ 3 (61.1% vs. 56.4%, p = 0.142).
