
Figure 2.
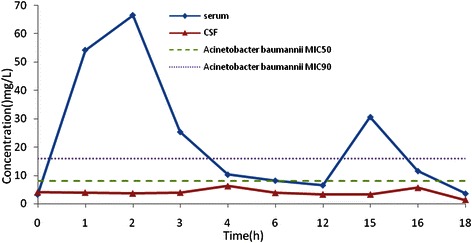
Sulbactam serum concentration-time curve in the group. Square dotted lines represent sulbactam against Acinetobacter baumanniiMIC50 and MIC90, most areas under the curve were beyond the MIC90, T>MIC% was greater than 50%. Triangular dotted lines represent sulbactam against Acinetobacter baumanniiMIC50, all the area under the curve were blow the MIC50.