
Figure 2.
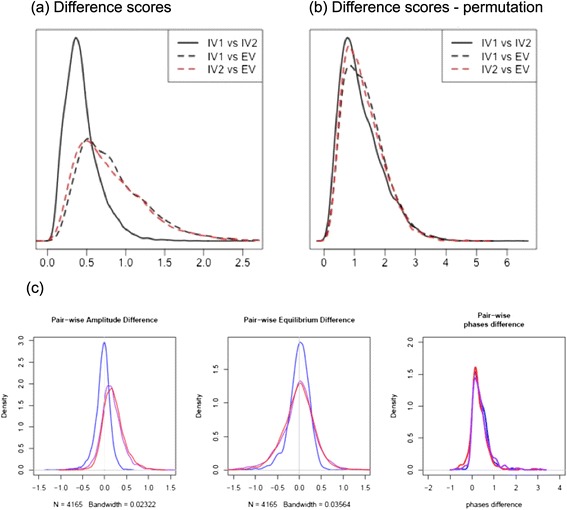
Overall differences between in vitro and ex vivo time courses. (a) The distributions of pair-wise difference scores for all genes showing the similarity of the two in vitro experiments and how they differ from the ex vivo experiment (b) the distributions of pair-wise difference scores from a permutation showing that the difference scores do not occur by chance. (c) Comparison of amplitude, equilibrium and phase between ex vivo and in vitro samples. These plots show the distribution of pair-wise difference of amplitude, equilibrium and phase values of ex vivo and in vitro I (red), ex vivo and in vitro II (pink), and in vitro I and in vitro II (blue). The amplitude difference was defined between ex vivo and in vitro as the minimum difference between ex vivo and the two in vitro named as D-EVamp and the amplitude difference between the two in vitro samples as D-VVamp. The equilibrium difference (D-EVeqm and D-VVeqm,) and phase difference (D-EVph and D-VVph) were similarly defined.