
Figure 4.
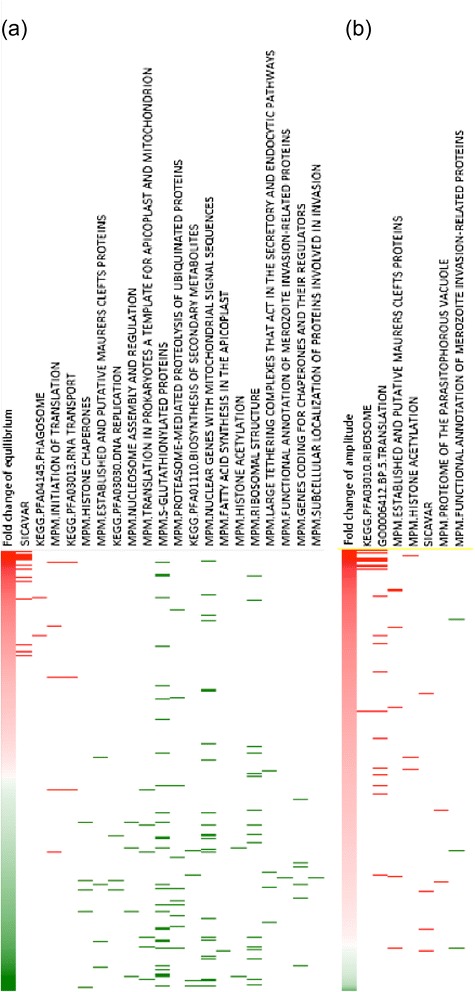
Functional enrichment analysis of DE genes using GSEA software. (a) Significantly enriched functional groups for genes differentially expressed at equilibrium levels (FDR < 25%, p value <0.05) (b) Enriched functional group of DE genes in amplitude (FDR < 25%). Red color represents up regulated genes. Green color represents down regulated genes. The short lines indicate genes from the corresponding functional pathway that is shown in the header.