
Figure 7.
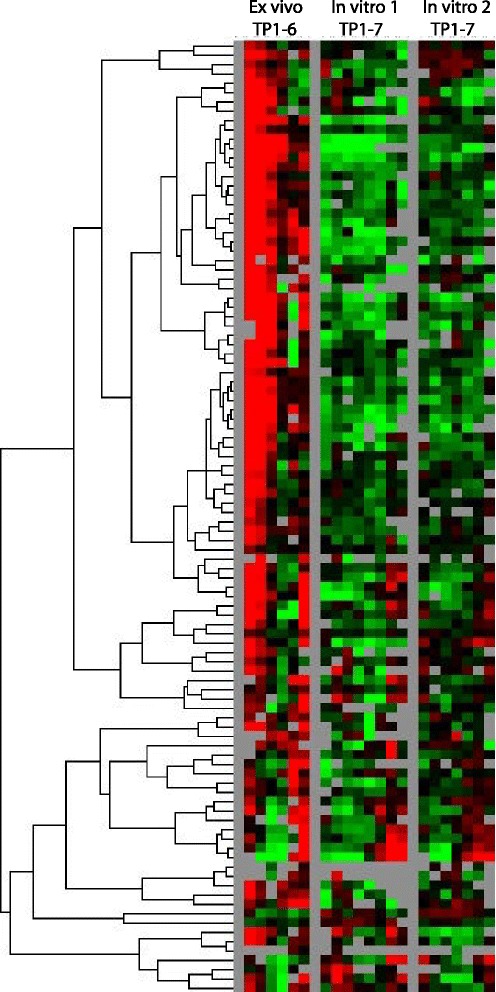
Heat map of all SICAvar genes in the ex vivo and two in vitro experiments, based on normalized intensity values.
Official websites use .gov
A
.gov website belongs to an official
government organization in the United States.
Secure .gov websites use HTTPS
A lock (
) or https:// means you've safely
connected to the .gov website. Share sensitive
information only on official, secure websites.
Heat map of all SICAvar genes in the ex vivo and two in vitro experiments, based on normalized intensity values.