
Figure 2. LSD1+8a Mainly Binds the Promoters of Genes Activated during Neuronal Differentiation.
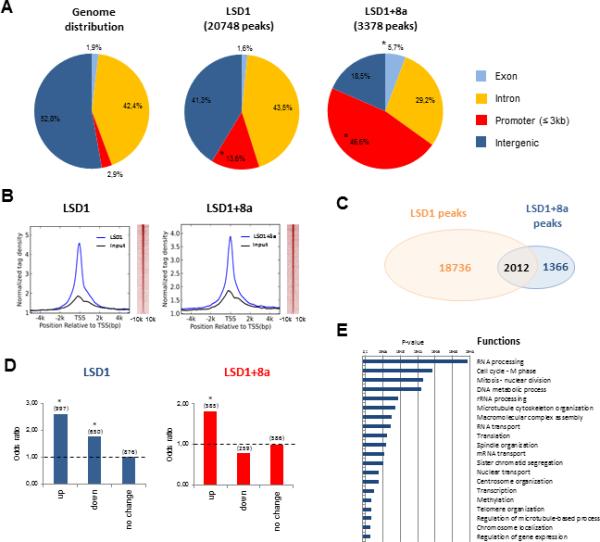
(A) Genomic distribution of LSD1 (20,748) and LSD1+8a (3,378) binding sites in SH-SY5Y cells at day B3 of differentiation. (*) p 9 10−4 assessed using one-sided binomial test.
(B) Normalized LSD1 and LSD1+8a tag density distribution at all genes’ promoters, in a relative distance of 5,000 bp from the TSS (left panel). Heatmap analysis of LSD1 and LSD1+8a distribution at promoter regions, in a relative distance of 10 kb from the TSS (right panel).
(C) Venn diagram showing the overlap between LSD1 and LSD1+8a peaks in the SH-SY5Y cells at day B3 of differentiation. p 9 10−4 assessed using hypergeometric test.
(D) LSD1 and LSD1+8a binding site enrichment for genes upregulated (up), downregulated (down) or with stable expression (no change) during neuronal differentiation of SH-SY5Y cells. Odds ratios were calculated by comparing the expression levels of LSD1 and LSD1+8a targets from day B0 to B3 of differentiation. (*) p 9 10−4.
(E) Gene ontology analysis of LSD1+8a target genes upregulated during neuronal differentiation.
See also Figure S2.