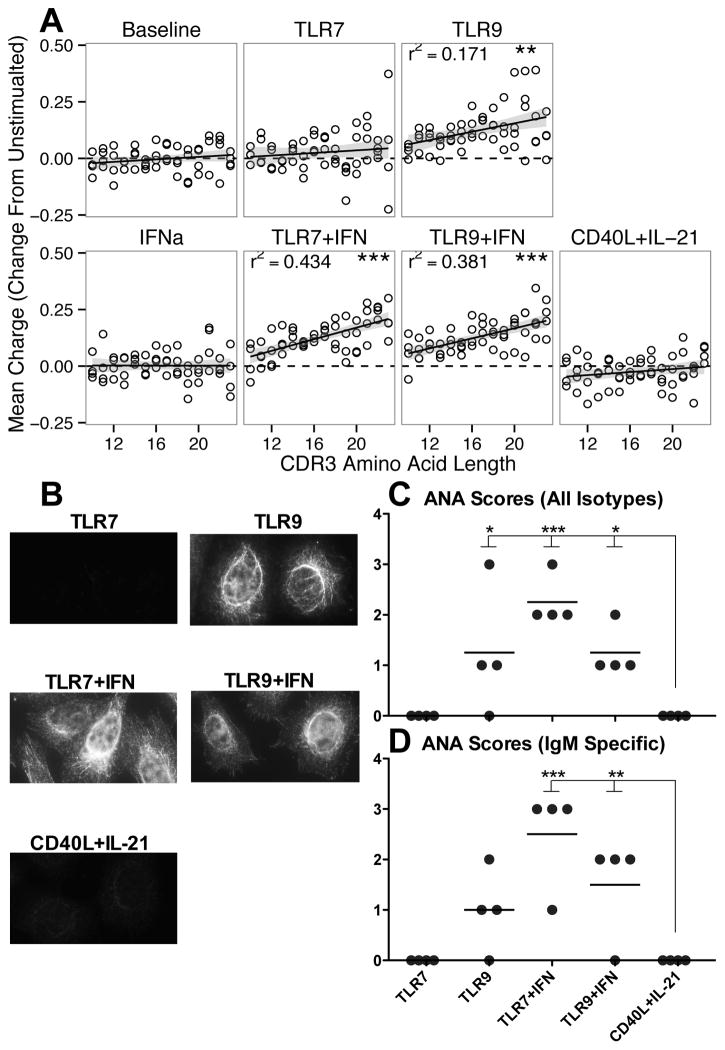
Figure 9. TLR stimulation induced autoreactive antibodies.
A: TLR activation induced a mean charge increase that was positively correlated with CDR3 length. Plots indicate data normalized intra-donor to unstimulated cultures, and CDR3 length range represents modal 90% of lengths. Grey line represents 95% confidence interval tracing for linear model and dotted black line as reference for no change. r refers to Pearson correlation coefficient. B: Representative images obtained from probing culture supernatants for reactivity against HEp2 cells, showing induction of autoreactive antibodies following TLR stimulation. Summary of antinuclear staining scores for all donors using either anti-light chain (C) or anti-IgM isotype (D) detection reagents. Supernatant reactivity was graded on a scale of 0 (negative) or 1+ (weak staining) through 4+ (intense staining). * = p < 0.05; ** = p < 0.01; *** = p < 0.001. A: Data represent four independent donors, split across two independent sequencing runs. B: representative images from one donor. C–D: summary of four independent donors, each with two slides stained.

