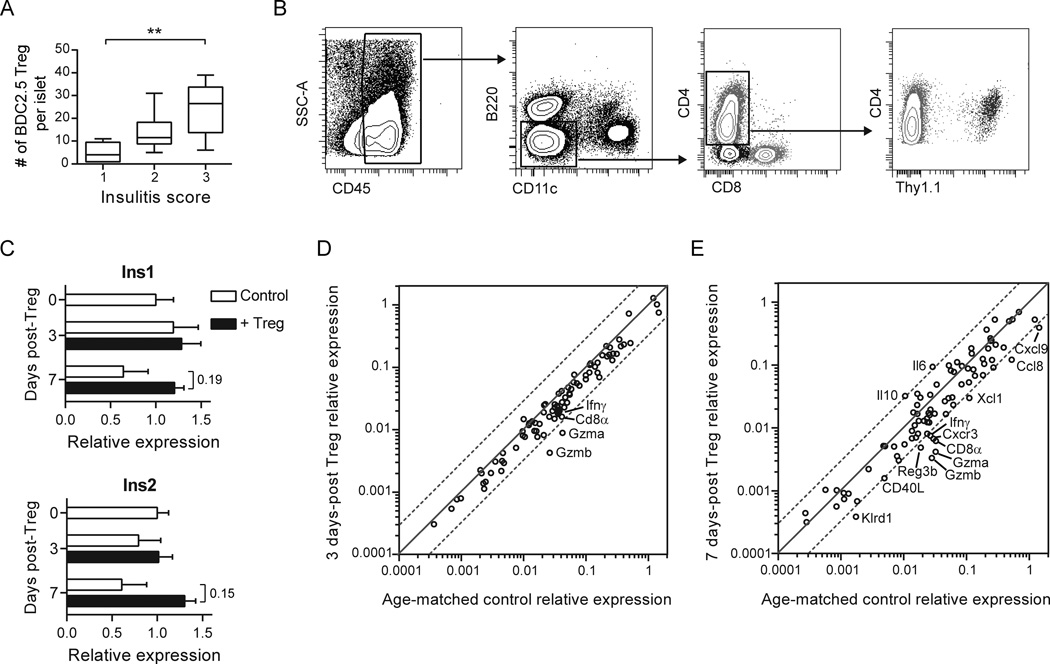
Fig. 1.
Tregs traffic to inflamed islets where they down-regulate an effector T cell signature. (A) BDC2.5 Tregs were enumerated in isolated NOD.CD11c-YFP.CD28−/− islets scored for insulitis using two-photon microscopy at 1 to 7 d post-Treg transfer. Insulitis score 1 = minimal infiltrate; 2 = infiltrate confined to <50% of islet; 3 = infiltrate covering >50% of islet. Box whiskers represent min to max of 6–8 islets per group analyzed over 2 independent experiments. Kruskal-Wallis test followed by Dunn’s post test, **, P < 0.01. (B) BDC2.5 Tregs and immune infiltrates persist in the islets following Treg treatment. Flow cytometry plots depict the gating strategy for various immune cell populations in the islets of a NOD.CD28−/− mouse 2 weeks post-transfer of Thy1.1+ BDC2.5 Tregs. Within islet single cell suspensions, immune infiltrates were gated as CD45+. APCs were excluded by gating on B220−CD11c− cells, and then CD4+ and CD8+ T cells were gated from this double negative population. Transferred BDC2.5 Tregs were identified among CD4+ T cells by their expression of Thy1.1. (C–E) mRNA was isolated from islets pooled from 4–5 NOD.CD28−/− mice at the time of Treg transfer and at 3 and 7 d after Treg treatment. (C) Expression of insulin 1 and 2 at day 0, 3, and 7 post-Treg treatment, normalized to time of treatment baseline. Data represent the average from 2 independent experiments. Bar graphs display mean ± SEM. P values (shown for day 7 treated vs. untreated) were determined using the Holm-Sidak method for multiple t tests. (D, E) Scatter plots displaying the relative abundance of mRNA transcripts in NOD.CD28−/− islets at 3 d (D) and 7 d (E) following Treg treatment, as compared to age-matched controls. Dashed lines represent a 3-fold difference between groups. Data are from 2 independent experiments.

