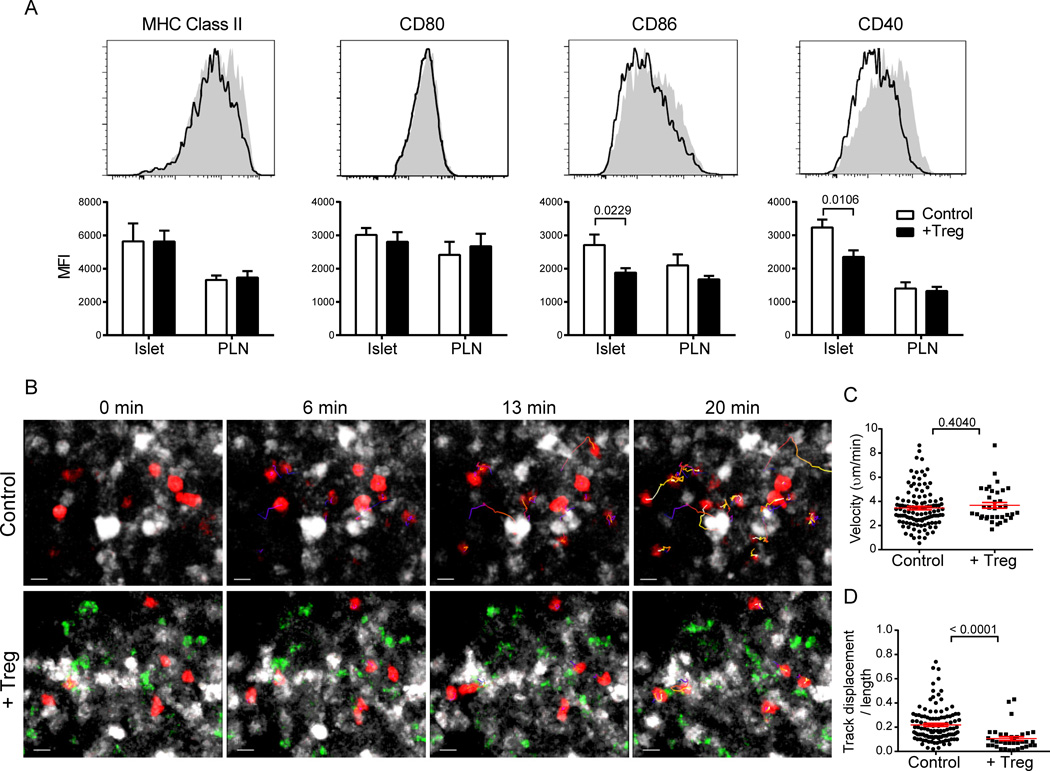
Fig. 3.
Treg treatment does not inhibit islet T cell-DC interactions. (A) Histograms depict expression levels of the indicated molecules on islet DCs of age-matched control (shaded) and 7 d post-Treg-treatment (outline) NOD.CD28−/− mice. DCs were gated as CD45+CD11c+B220−DAPI−. Bar graphs depict median fluorescent intensities. Data represent mean ± SEM of 6–10 mice per group from 2–3 independent experiments. P values were determined by Mann-Whitney test. (B–D) 107 CMTMR-labeled 8.3 CD8+ T cells were transferred to NOD.CD11c-YFP.CD28−/− mice at 7 d post-uGFP.BDC2.5 Treg treatment and to untreated controls. Islets were harvested the following day and imaged by two-photon microscopy. (B) Maximal projection time-lapse images from control and Treg-treated islets depicting CD11c+ DCs (white), 8.3 CD8+ T cells (red), and BDC2.5 Tregs (green, + Treg only). Track lines depict 8.3 CD8+ T cell movements over the course of the 20 min imaging period and are color-coded according to time (blue at the beginning of the imaging period to white at the end). Scale bars represent 10 µm. See Supplemental Videos 2 and 3 for full time lapses. (C, D) Graphs depict velocities (C) and confinement ratios (D) of 8.3 CD8+ T cells. Each point represents a single cell; red bars represent mean ± SEM. Data are from multiple islets imaged over 2 independent experiments. P values were determined by Mann-Whitney test.

