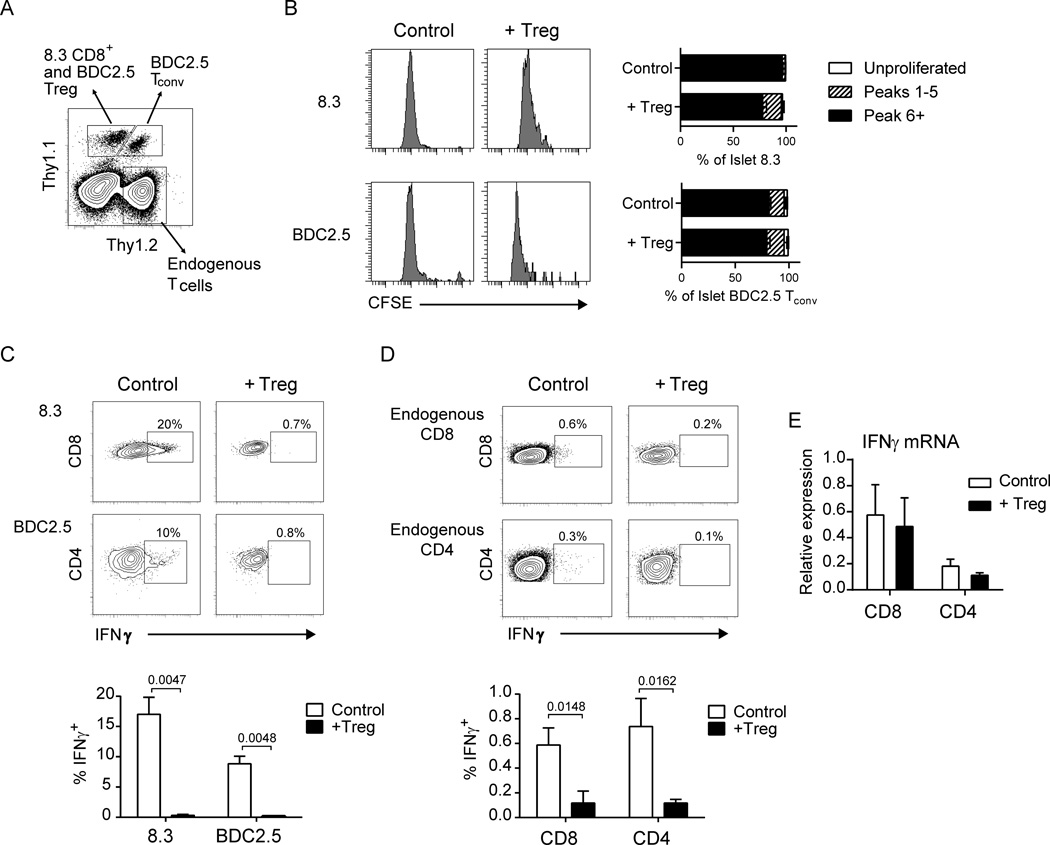
Fig. 4.
Tregs suppress islet T cell effector function. (A–D) 106 CFSE-labeled 8.3.Thy1.1+ CD8+ T cells and BDC2.5.Thy1.1+Thy1.2+ CD4+CD25− T cells were transferred to NOD.CD28−/− mice 3 d following BDC2.5.Thy1.1+ Treg treatment or to untreated littermates and analyzed 4 d later. (A) Representative flow plot depicting gating of endogenous and transferred T cells. Cells were pre-gated as CD45+ lymphocytes. Transferred 8.3 CD8+ T cells and BDC2.5 Tregs were gated as Thy1.1+Thy1.2− and were further differentiated based on CD8 and CD4 expression. BDC2.5 conventional CD4+ T cells were Thy1.1+Thy1.2+. Endogenous T cells were Thy1.2+Thy1.1− (B) Representative histograms pre-gated on Thy1.1+ CD8+ 8.3 T cells and Thy1.1+Thy1.2+CD4+ BDC2.5 T cells depicting CFSE dilution of transferred cells in the islets with and without Treg treatment. Bar graphs depict the percentage of cells that did not divide (Unproliferated), underwent 1–5 rounds of division (Peaks 1–5), or underwent 6 or more rounds of division (Peak 6+). Kruskal-Wallis test followed by Dunn’s post test, *, P < 0.05. (C) Representative flow plots pre-gated on 8.3 CD8+ (top) and BDC2.5 Tconv (bottom) cells showing IFNγ expression by intracellular flow cytometry. Bar graph depicts summary data from 6 mice per group from 2 independent experiments. (D) Representative flow plots pre-gated on endogenous islet Thy1.2+Thy1.1− CD8+ (top) and CD4+ (bottom) T cells and quantification of the percent expressing intracellular IFNγ+. Bar graph depicts summary data as in C. Bar graphs depict mean ± SEM. P values for C and D were determined by Mann-Whitney test. (E) qRT-PCR data measuring transcript levels of IFNγ for CD8+ and CD4+ T cells sorted from pooled islets of 3–4 NOD.CD28−/− mice at 7 d post-Treg treatment or from age-matched controls. Expression levels are normalized to 18s rRNA expression. Data are represented as the mean ± SEM of 4 independent experiments. No statistically significant difference was observed between control and Treg-treated samples by Wilcoxon matched-pairs signed rank test.

