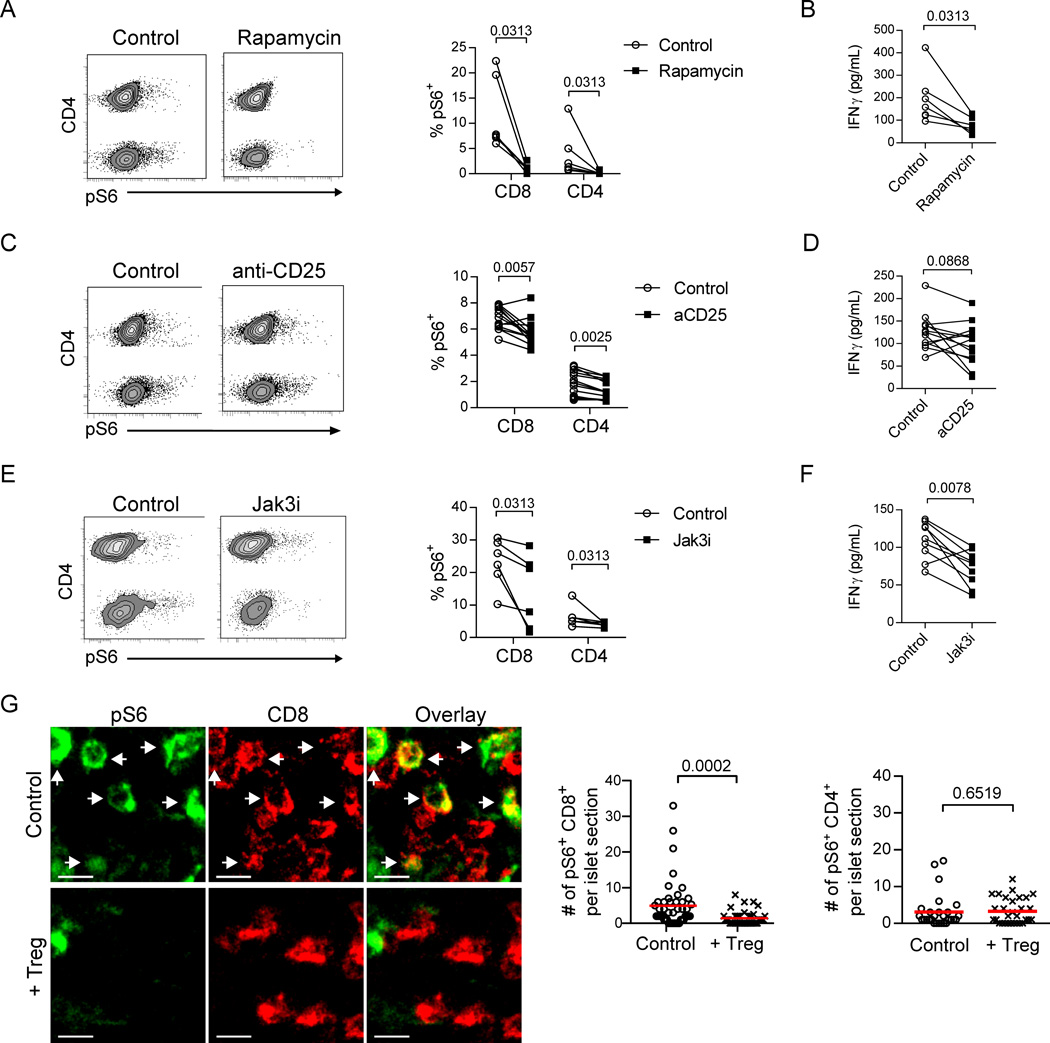
Fig. 5.
Tregs suppress mTOR signaling in islet CD8+ T cells that is critical for IFNγ production. (A, C, E) Representative flow plots showing T cells from isolated islets of NOD.CD28−/− mice that were dissociated and cultured overnight in the presence or absence of rapamycin, anti-CD25 antibody, or Jak3 inhibitor. Depicted T cells were gated as viability dye−CD45+CD11c−B220−Thy1.2+. CD4 expression on the y-axis of the flow plots separates CD4+ T cells on the upper half of the plot from CD8+ T cells on the lower half. Graph depicts the mean percent of T cells expressing pS6 ± SEM. (B, D, F) Concentrations of IFNγ in culture supernatants were determined by ELISA. Each connected pair of data points represents cells from one mouse. Data for A–F are from 2–3 independent experiments. P values were determined by Wilcoxon matched-pairs signed rank test. (G) Representative immunofluorescence images of stained pancreas sections from NOD.CD28−/− mice at 7 d post-BDC2.5 Treg treatment or from untreated littermates. pS6 signal is indicated in green and CD8+ T cells are shown in red. White arrows highlight co-expression. Scale bars represent 10 µm. Graphs quantify the number of CD8+ T cells (left) or CD4+ T cells (right) per islet section expressing pS6. Data are combined from 3 independent experiments with a total of 3 mice for each condition. Each point represents an individual islet; red lines indicate the mean. P values were determined by Mann-Whitney test.

