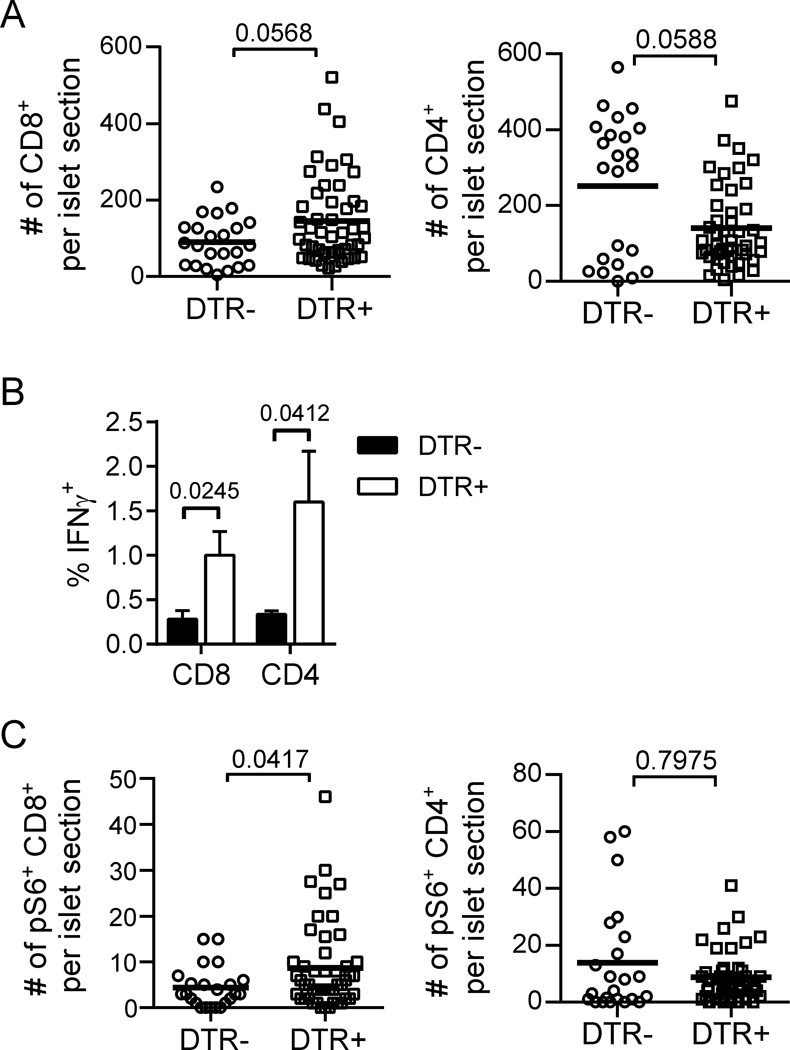
Fig. 6.
Treg depletion in NOD mice enhances islet T cell effector function, CD8+ T cell numbers and mTOR activation. NOD.Foxp3DTR+ mice and transgene-negative littermate controls were sacrificed for analysis following 2 d of DT treatment. (A) Numbers of CD8+ T cells (left) and CD4+ T cells (right) per islet section were quantified by immunofluorescence microcopy. (B) Islet T cell IFNγ production was determined by ex vivo intracellular cytokine staining as in Figure 4. Data are from 6 mice per group combined from 2 independent experiments. Bar graph depicts mean ± SEM. (C) Numbers of pS6+ CD8+ T cells (left) and pS6+ CD4+ T cells (right) per islet section were quantified by immunofluorescence microcopy. Data for A and C are combined from 2 independent experiments with a total of 3–5 mice for each condition. Each point represents an individual islet; bold lines indicate the mean. P values were determined by Mann-Whitney test.

