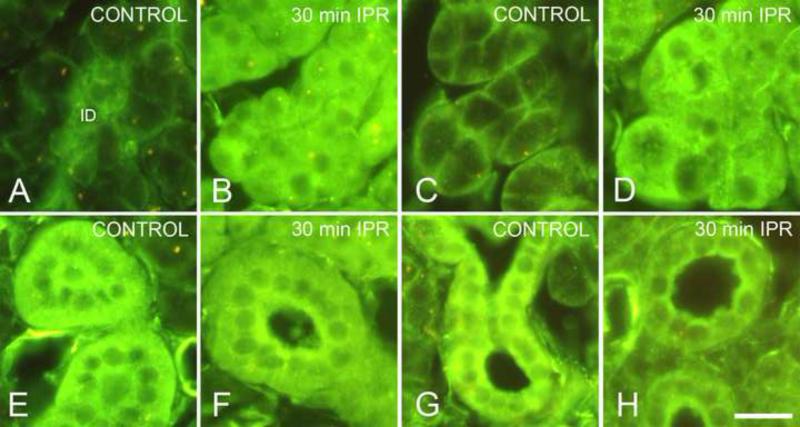
Figure 4.
Distribution of Gαs in acinar and striated duct cells. Scale bar = 20 μm. (For color reproduction on the Web and in print.)
A. Parotid acinar cells, unstimulated control. Basolateral membranes of acinar cells are labeled; intercalated duct cells (ID) show cytoplasmic labeling.
B. Parotid acinar cells, 30 min isoproterenol. Gαs is distributed throughout the cytoplasm of acinar cells; nuclei are unlabeled.
C. Submandibular acinar cells, unstimulated control. Basolateral membranes of acinar cells are labeled.
D. Submandibular acinar cells, 30 min isoproterenol. Gαs is distributed throughout the cytoplasm of acinar cells.
E. Parotid striated duct, unstimulated control. Gαs is distributed throughout the cytoplasm of striated duct cells.
F. Parotid striated duct, 30 min isoproterenol. Fluorescence intensity appears greater in the apical cytoplasm of striated duct cells.
G. Submandibular striated duct, unstimulated control. Gαs is distributed throughout the cytoplasm of striated duct cells.
H. Submandibular striated duct, 1 hr isoproterenol. Fluorescence intensity appears greater in the apical cytoplasm of striated duct cells.

