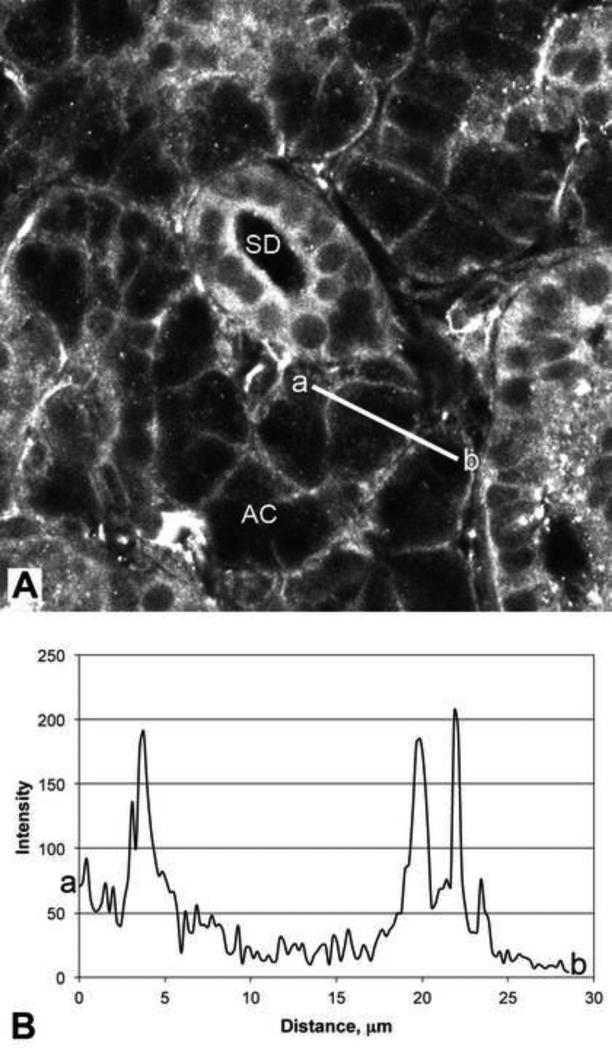
Figure 5.
Fluorescence intensity distribution in submandibular acinar cells.
A. Confocal image of a section of an unstimulated submandibular gland labeled with antibody to Gαs. The line a-b indicates the path and length of the intensity scan shown in panel B. Acinar cells (AC); striated duct (SD).
B. Fluorescence intensity scan across the acinar cell shown in panel A. The beginning of the scan is indicated by ‘a’, and the end of the scan by ‘b’. The peaks at 4, 20 and 22 μm represent Gαs associated with the plasma membrane.

