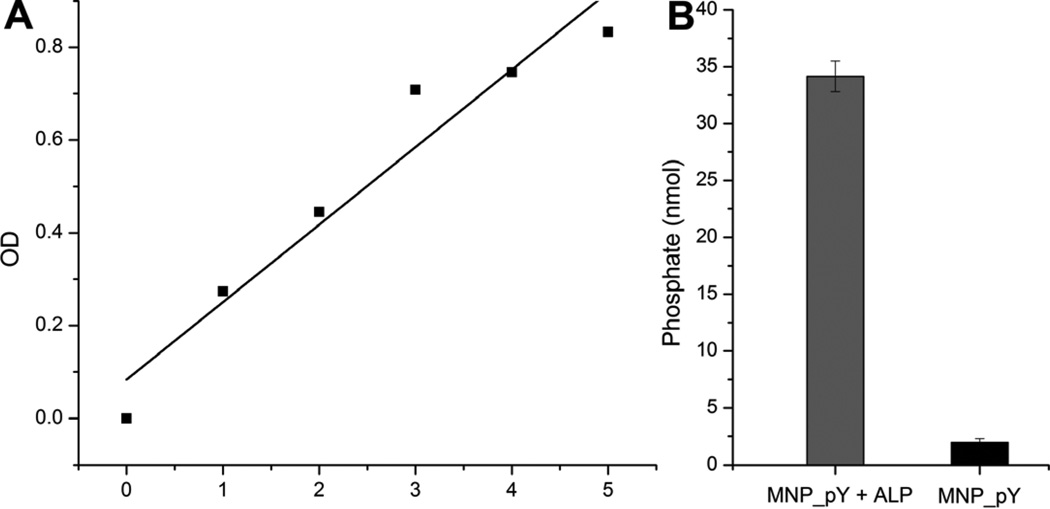
Figure 2.
(A) Phosphate standard curve performed according to the phosphate assay (ab65622, abcam). (B) Average amount of the phosphates on 40 μg MNP_pY. Gray bar indicates amount of phosphates in MNP_pY treated with ALP for 24 hrs; and black bar indicates amount of phosphates from the MNP_pY treated with di H2O for 24 hrs.

