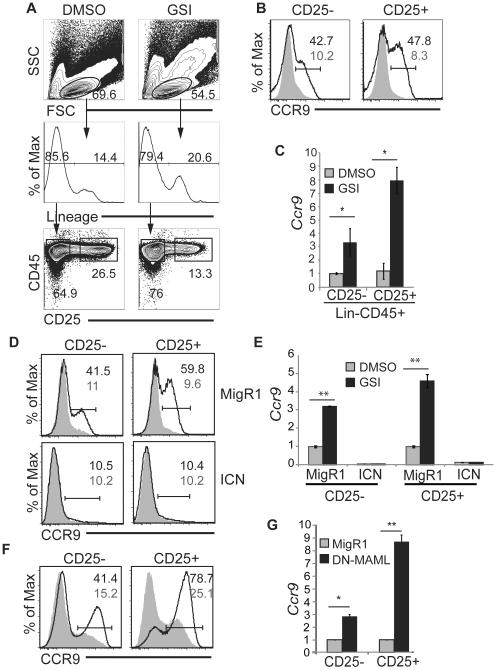
Figure 2. Notch signaling represses Ccr9 mRNA and CCR9 protein expression in primary T cell progenitors.
(A) Gating strategy for identification of Lin−CD45+CD25− and Lin−CD45+CD25+ progeny of FL MPPs after 7 days of culture in which DMSO or GSI (10 μM) were added for the final 48 hours. The frequency of cells in each of the indicated gates is shown. (B) Expression of CCR9 on Lin−CD45+CD25− (CD25−) and Lin−CD45+CD25+ (CD25+) cells cultured on OP9-DL1 for 7 days including a 48 hour treatment with DMSO (shaded histogram) or GSI (DAPT, 10 uM) (open histogram). The frequency of CCR9+ cells in GSI (black) and DMSO (grey) treated samples is indicated. (C) QPCR analysis for Ccr9 in Lin−CD45+CD25− and Lin−CD45+CD25+ FL MPPs cultured in vitro for 7 days including a 48 hour treatment with DMSO (grey) or GSI (black) as in (B). Hprt mRNA was used for normalization. Error bars = standard deviation. (D) FL MPPs were transduced with MigR1 or MigR1-ICN on day 4 of culture and treated with DMSO (shaded histogram) or GSI (open histogram) for 48 hours starting on day 5 of culture. CCR9 on Lin−CD45+GFP+CD25− (CD25−) and Lin−CD45+GFP+CD25+ (CD25+) cells is shown. The frequency of cells expressing CCR9 in GSI (black) and DMSO (grey) treated cultures is indicated. (E) QPCR analysis for Ccr9 mRNA in the Lin−CD45+GFP+CD25− and Lin−CD45+GFP+CD25+ in the progeny of FL MPPs treated with DMSO (grey) or GSI (black) as described in (D) after infection with MigR1 or MigR1-ICN. (F) CCR9 expression on the Lin−CD45+GFP+CD25− and Lin−CD45+GFP+CD25+ progeny of FL MPPs that were transduced with MigR1 (shaded histogram) or MigR1-DN-MAML (open histogram) on day 4 of culture (D) and analyzed on day 7. (G) QPCR analysis for Ccr9 mRNA in the Lin−CD45+GFP+CD25− and Lin−CD45+GFP+CD25+ progeny of FL MPPs as described in (F) after infection with MigR1 (grey) or MigR1-DNMAML (black). All experiments are representative of > 3. For QPCR analysis, * = p<0.05, ** = p<0.01.

