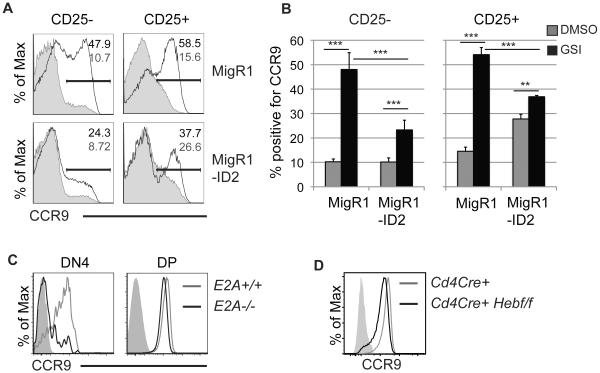
Figure 3. The E protein transcription factors contribute to CCR9 expression on primary T cell progenitors.
(A) FACS analysis for CCR9 on CD25− and CD25+ Lin−CD45+GFP+ FL MPPs culture in vitro for 3 days prior to infection with MigR1 or MigR1-ID2 retrovirus and treated with DMSO (shaded histogram) or GSI (open histogram) on day 5 for 48hrs. The frequency of CCR9+ cells on GSI (black) or DMSO (grey) treated cells is indicated. One of four representative experiments is shown. (B) Average + standard deviation of the percent of CD25− and CD25+ Lin−CD45+GFP+ cells expressing CCR9 after treatment as in (A). n=4, ** = p<0.01 and *** = p<0.001. (C) FACS analysis for CCR9 protein on Lin−CD44−CD117−CD25− DN4 thymocytes and CD4+CD8+ DP thymocytes isolated from an E2A+/+ or E2A−/− mouse. One of three experiments is shown. (D) FACS analysis for CCR9 protein on DP thymocytes from a Cd4Cre/- or Cd4Cre+/-Hebf/f mouse.

