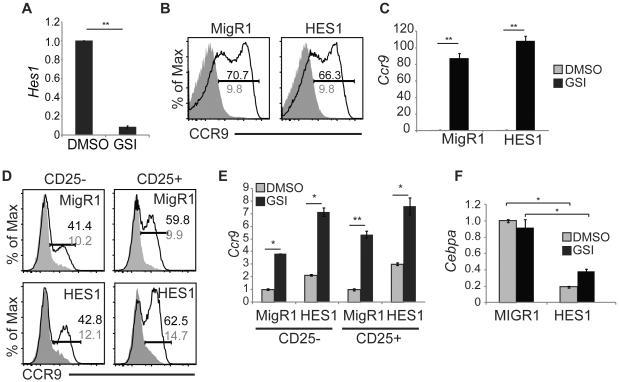
Figure 6. HES1 is not sufficient to repress Ccr9 mRNA.
(A) QPCR analysis for Hes1 mRNA in 531026 cells treated with DMSO or GSI for 48 hours. Hprt mRNA was used for normalization. (B) FACS analysis for CCR9 on 531026 cells treated with DMSO (shaded histogram) or GSI (open histogram) for 48 hours following infection with MigR1 or MigR1-HES1. The frequency of CCR9+ cells on GSI (black) and DMSO (grey) treated cells is indicated by the gated region. (C) QPCR for Ccr9 mRNA in 531026 cells treated with DMSO (grey) or GSI (black) for 48 hours following infection with MigR1 or MigR1-HES1. Hprt mRNA was used for normalization. (D). FACS analysis for CCR9 protein on CD25− or CD25+ Lin−CD45+GFP+ FL MPPs treated with DMSO (shaded histogram) or GSI (open histogram) for 48hrs following infection with MigR1 or MigR1-HES1. The frequency of CCR9+ cells on GSI (black) and DMSO (grey) treated cells is indicated by the gated region. (E) QPCR analysis for Ccr9 mRNA in the same DMSO (grey) and GSI (black) populations as in (D). Hprt mRNA was used for normalization. (F) QPCR analysis for Cebpα mRNA in Lin−CD45+ FL-MPPs treated with DMSO (grey) or GSI (black) for 48 hours. * = p<0.05, ** = p<0.01. All experiments were performed at least 3 times.

