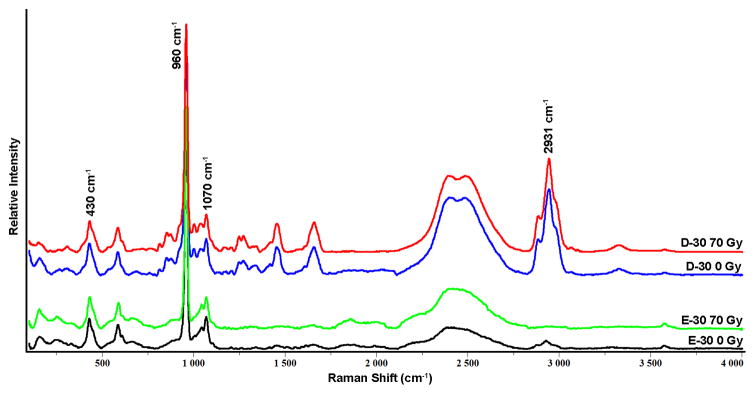
Fig. 3.

Representative Raman spectra from enamel and dentin sites 30 microns from the DEJ (E-30 and D-30) from tooth sections before (0 Gy) and after (70 Gy) simulated radiotherapy. Spectra were normalized based on ν1 of the phosphate 960 cm−1 peak height.
