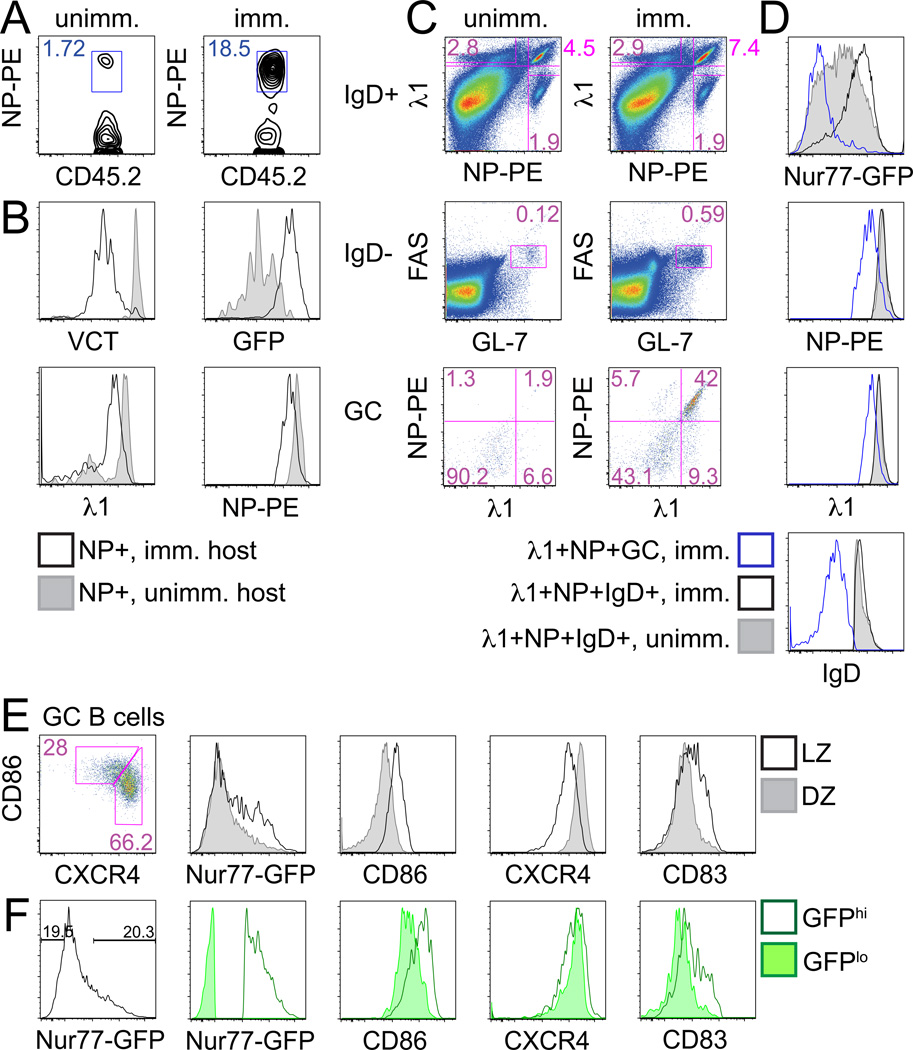
Figure 1. Nur77-GFP reporter identifies B cells activated by antigen in vivo.
(A, B) B1-8 reporter splenocytes loaded with CTV were adoptively transferred into CD45.1 BoyJ recipients. Recipient splenocytes were stained 3 days after NP-KLH immunization. (A) Plots represent CD45.2+ donor cells from unimmunized (left) and immunized (right) hosts stained with NP-PE. (B) Histograms represent VCT, GFP, surface NP, and λ1 expression in NP+ donor B cells from immunized (black line) or unimmunized (shaded histogram) recipients as gated in (A). Data are representative of 4 biological replicates.
(C–F) B1-8 reporter splenocytes were harvested and stained d9 after NP-KLH immunization. (C) Plots depict gating to identify: IgD+λ1+NP+ B cells (top panels), IgDnegFashiGL-7hi GC B cells (middle panels), and λ1+NP+GC B cells (bottom panels) from unimmunized (left) and immunized (right) mice. (D) histograms represent GFP, NP, λ1, and IgD expression in λ1+NP+ GC B cells (blue line), λ1+NP+IgD+ B cells from immunized mouse (black line) or λ1+NP+ IgD+ B cells from unimmunized mouse (shaded histogram) as gated in (C). (E) Histograms represent GFP, CD86, CXCR4, and CD83 expression in overlayed LZ (CD86hiCXCR4lo) and DZ (CD86loCXCR4hi) phenotype GC B cells from immunized B1-8 mice as gated in left-hand panel plot. (F) Right hand histograms depict same markers in GFP-low and GFP-high GC B cells gated as in left hand histogram. Data are representative of 4 biological replicates.

