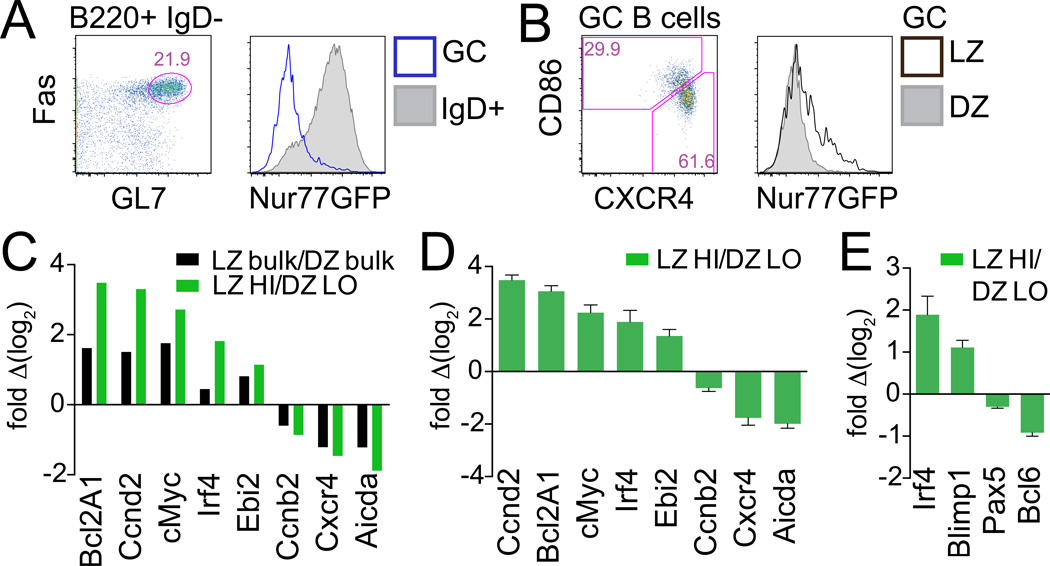
Figure 3. Nur77-GFP expression correlates with LZ gene expression signature.
(A–B) B6 reporter splenocytes were stained d8 after LCMV infection. (A) Plots represent gating to identify B220+IgDnegFashiGL7hi GC B cells (lefthand panel). Overlayed histograms (righthand panel) represent GFP expression from IgD+ (shaded histogram) and GC B cells (blue line). (B) Plot and histogram as described in Fig. 1E. Data are representative of at least 2 independent experiments with 2–3 mice per time point per experiment.
(C–E) GC B cells from B6 reporter mice infected with LCMV were sorted (see Fig. S2E for gating), and transcript abundance was assessed by qPCR. (C) shows enrichment of LZ-DZ gene expression signatures in GFP-sort relative to bulk sort; data from one sort shown here is representative of 3 independent sorts. (D and E) present qPCR data from 3 independent sorts +/− SEM to demonstrate reproducibility.

