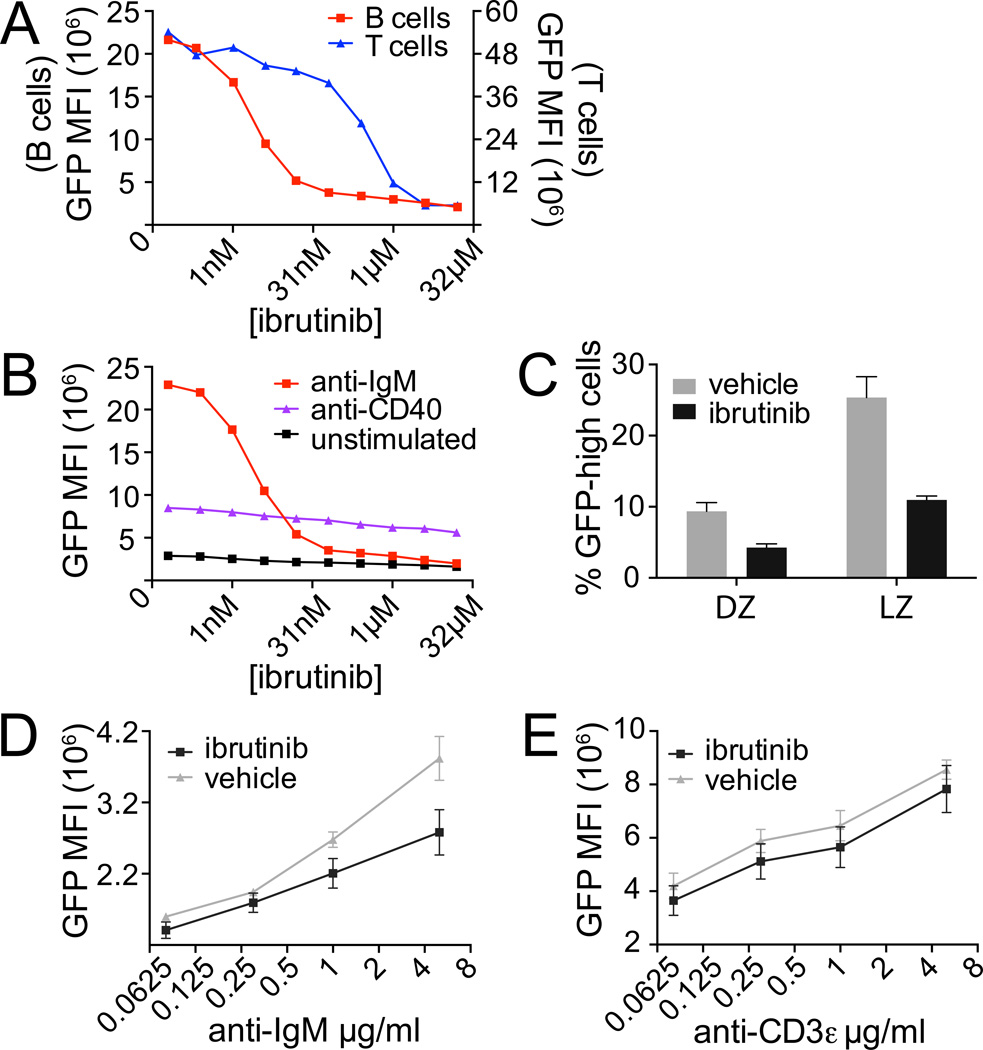
Figure 4. Nur77-GFP expression in GC B cells is dependent upon BCR signaling.
(A) Reporter LN cells were treated with 5µg/ml of either anti-IgM or anti-CD3ε along with varying concentrations of ibrutinib and then stained after 16 hrs for B220, CD4, and CD69 expression. Graph depicts GFP MFI of CD4 T cells or B cells. Data are representative of 2 independent experiments.
(B) Reporter LN cells were treated with 4µg /ml of anti-IgM, 1 µg /ml of anti-CD40, or neither along with varying concentrations of ibrutinib and then stained after 16 hrs as above. Graph depicts GFP MFI of B cells. Data are representative of 2 independent experiments.
(C) LN cells harvested d13 from mice treated with vehicle or ibrutinib on days 10, 11, and 12 following LCMV infection were stained and gated as in Supplemental Figure 2I, J. Graph depicts % GFP-high LZ and DZ B cells.
(D, E) LN cells harvested from mice treated as in (C) were restimulated with varying doses of either anti-IgM (D) or anti-CD3ε (E) for 4 hrs without additional inhibitor, after which cells were stained as in (A). Graph depicts GFP MFI of B cells (D) or T cells (E) normalized to GFP MFI of individual PMA-treated samples (positive control). Data plotted in C–E are the mean +/− SEM of 3 biological replicates.

