
Fig. 5. The structural and functional avidity range of A2/MART1 TCRs consisting of SIG35α is very broad and further enhanced by the presence of CD8.
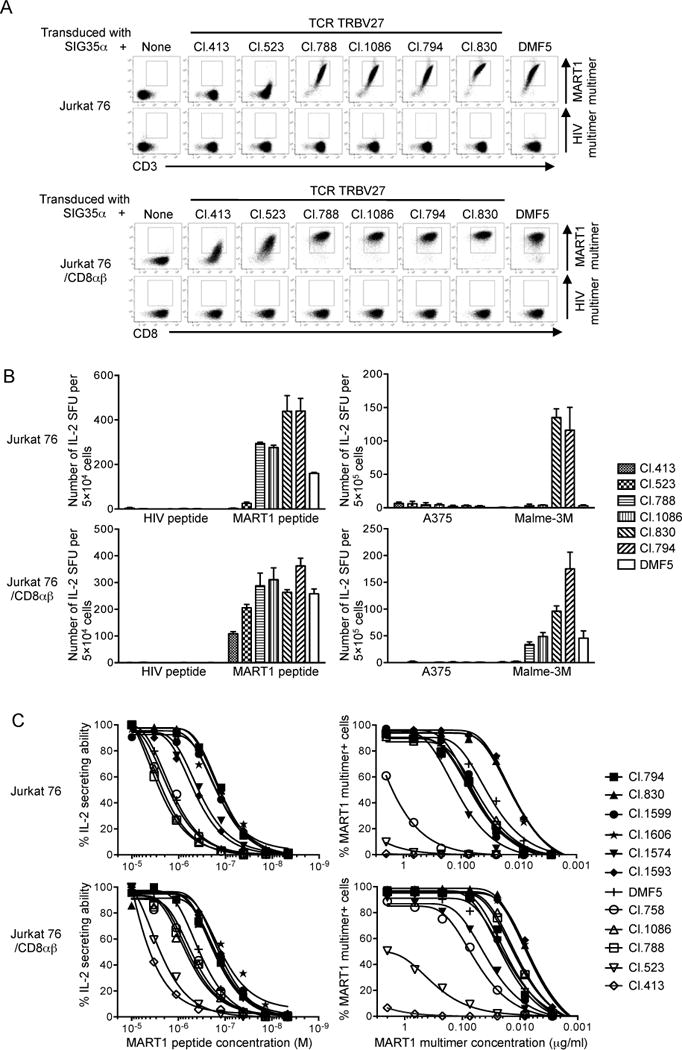
Jurkat 76 cells, which lack the expression of CD8αβ and endogenous TCRs, were retrovirally transduced with CD8αβ to produce Jurkat 76/CD8αβ. Jurkat 76 or Jurkat 76/CD8αβ cells were individually transduced with eleven distinct TRBV27 TCRβ chains along with SIG35α or with DMF5αβ chains. (A), A2/MART1 TCRs reconstituted on Jurkat 76 or Jurkat 76/CD8αβ cells were differentially stained by A2/MART1 multimer. All Jurkat 76 or Jurkat 76/CD8αβ transfectants were stained with 2 μg/ml A2/MART1 or A2/HIV multimer along with anti-CD3 mAb (top) or anti-CD8 mAb (bottom). Data for multimer staining of seven representative Jurkat 76 or Jurkat 76/CD8αβ transfectants are shown. Data for multimer staining of the remaining 5 transfectants are shown in Supplementary Fig. 3. (B), Reconstituted A2/MART1 TCRs are highly avid for A2/MART1 recognition. IL-2 ELISPOT assays were performed using seven representative Jurkat 76 or Jurkat 76/CD8αβ transfectants as responder cells. T2 cells pulsed with 10 μg/ml wild-type A2/MART1 or A2/HIV control peptide were used as stimulator cells (left). The A2+ MART1− melanoma line, A375, and the A2+ MART1+ melanoma line, Malme-3M were used as stimulator cells (right). All experiments were conducted in triplicate and error bars show SD. Data shown are representative of two independent experiments. (C), Reconstituted A2/MART1 TCRs possess a broad range of functional and structural avidities. Functional avidities of Jurkat 76 or Jurkat 76/CD8αβ cells expressing 11 different A2/MART1 TCRβ chains paired with SIG35α and DMF5 are depicted as % IL-2 secreting abilities determined by IL-2 ELISPOT assays using T2 cells pulsed with graded concentrations of wild-type A2/MART1 peptide as stimulator cells (left). Structural avidities of the same transfectants are shown as multimer staining percentages determined by staining with graded concentrations of A2/MART1 multimer (right). Data shown are representative of two independent experiments.