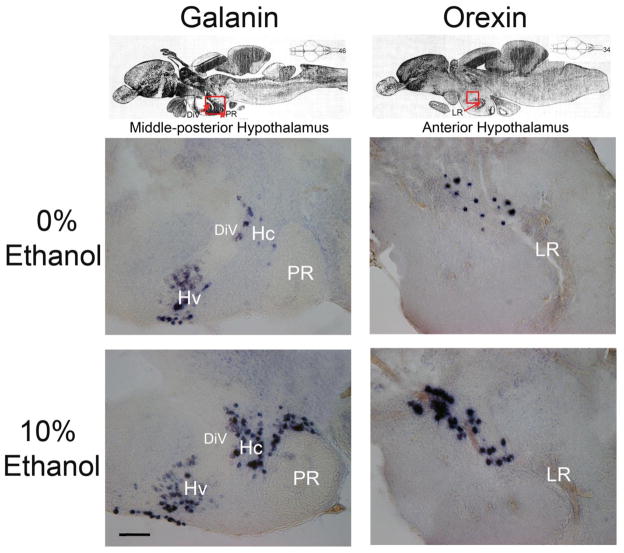
Fig. 4.
Photomicrographs illustrate changes in the density of galanin (column A) and orexin (column B) mRNA-expressing neurons in the hypothalamus in response to consumption of 20% ethanol-gelatin compared to 0% ethanol-gelatin, as revealed in sagittal sections with digoxigenin-labeled in situ hybridization. (A) Representative images from sagittal sections at the 46th section plane of the zebrafish brain, demonstrating a stimulatory effect of ethanol on galanin expression in the mid-posterior hypothalamus, outlined in red in the top panel. (B) Representative images from sagittal sections at the 34th section plane of the zebrafish brain, demonstrating a stimulatory effect of ethanol on orexin expression in the anterior hypothalamus, outlined in red in the top panel. DiV, diencephalic ventricle; Hc, caudal zone of periventricular hypothalamus; Hv, ventral zone of periventricular hypothalamus; LR, lateral recess of diencephalic ventricle; PR, posterior recess of diencephalic ventricle. Scale bar = 100μm. Top panels adapted from Wullimann, Rupp, and Reichert, Neuroanatomy of the Zebrafish Brain (1996), with permission from Birkhäuser Verlag [64].

