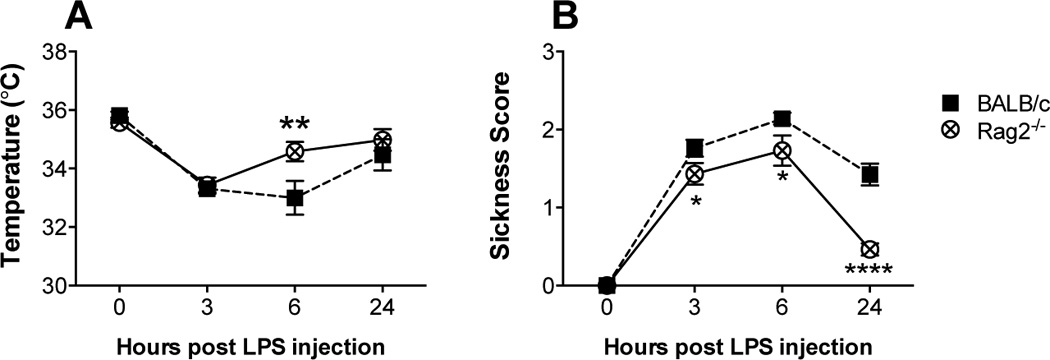
Figure 3.

Core body temperature (A) and sickness behavior (B) of BALB/c and Rag2−/− mice after receiving an LPS dose of 1 mg/kg of body weight. Analysis by two-way ANOVA revealed significant differences. (A) Temperature: main effects of time (p < 0.0001) and genotype (p = 0.0454) with a significant interaction (p = 0.025). (B) Sickness behavior: main effects of time (p < 0.0001) and genotype (p < 0.0001), interaction (p = 0.0005). Fisher’s LSD post hoc test: * p < 0.05, ** p < 0.01, **** p < 0.0001
